RELIABILITY & DURABILITY ASSESSMENT
Industrial Dosing-Pump Head
Illustrative durability assessment | flow drift, seal condition and intermittent leakage
Sector
Industrial process equipment
Duration
5–7 weeks
Decision
Release pathway
Decision to be made
Decide whether one pump-head configuration is stable enough for a field pilot, whether a seal or material change is required, or whether the performance risk needs to be contained before procurement.
Project Context
A hypothetical water-treatment OEM has observed inconsistent service intervals across two elastomer and seal configurations. The team needs a controlled comparison that connects observed leakage and flow-rate drift to operating cycles, not anecdotal maintenance reports.
Evidence Scope
- 8 pump heads: four per seal-and-material configuration
- 250,000 pumping cycles using a controlled aqueous surrogate
- Flow, pressure and leakage checks at defined cycle bands
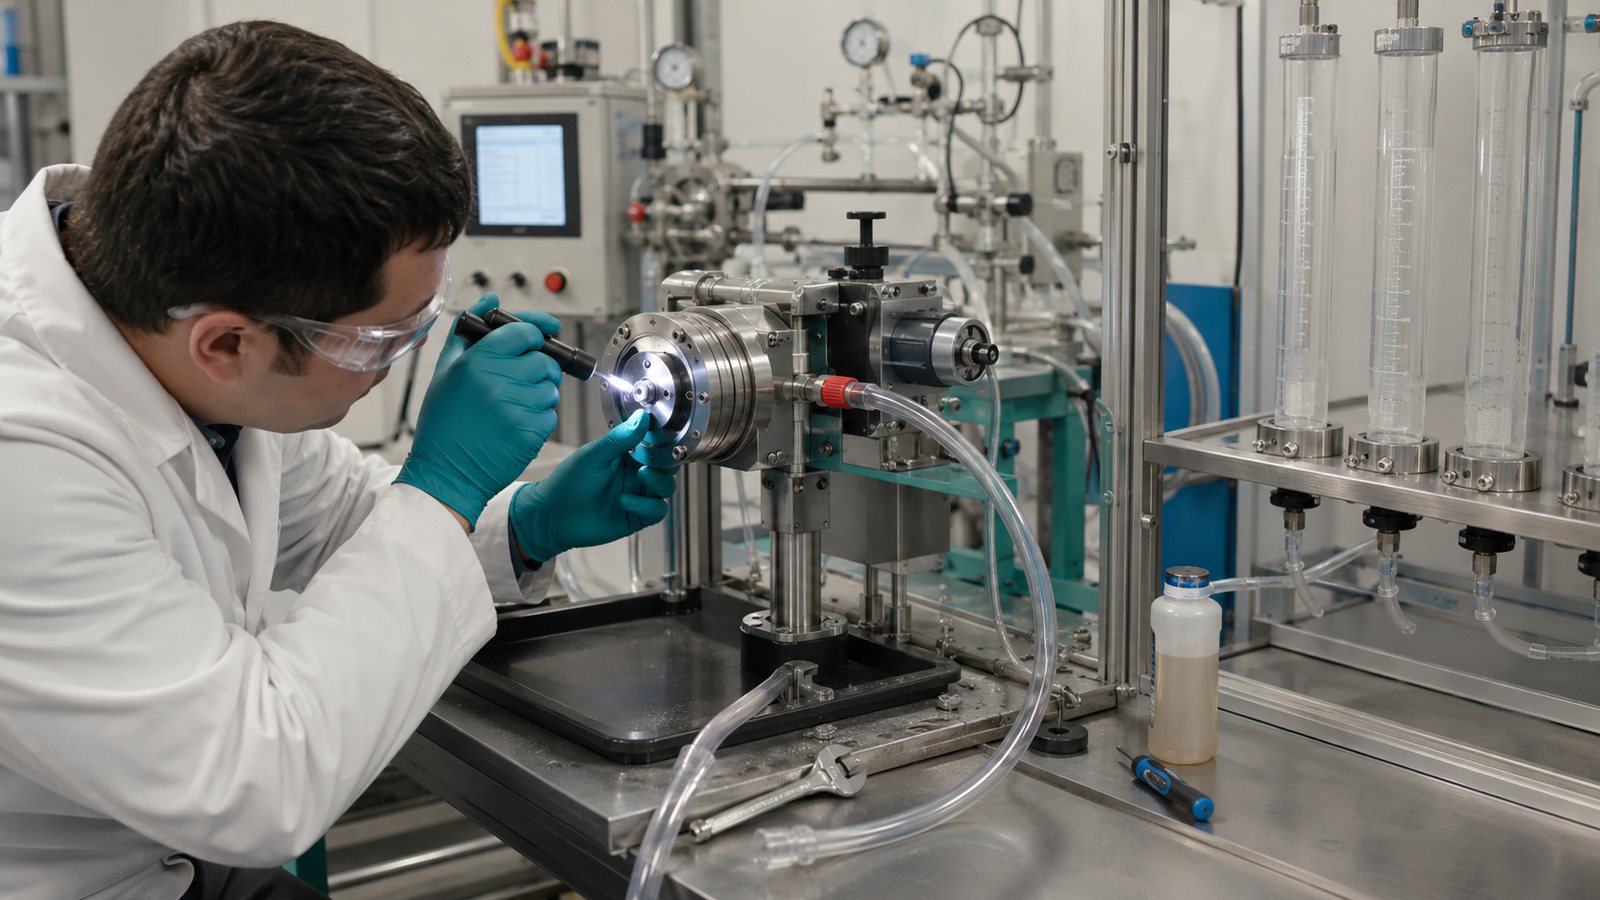
- Seal photographs and dimensional inspection after targeted teardown
Drift trace
Each specimen receives an individual performance trace. Instead of averaging failures away, the assessment preserves the cycle point, leakage observation and operating conditions for each unit.
Cycle band | Measured evidence | Illustrative interpretation |
|---|---|---|
0–25k | Baseline flow and pressure curve | Starting reference |
25k–75k | Flow deviation and seal-surface review | Early drift screen |
75k–150k | Leakage event log and repeatability check | Identify intermittent behaviour |
150k–250k | Final flow/pressure confirmation | Assess end-of-sequence retention |
Teardown | Seal compression and surface condition | Support failure hypothesis |
How the Work Would Be Delivered
August Research would define the evidence need, scout and assess suitable external laboratories or field settings, align the protocol and sample handling, coordinate testing checkpoints, and translate the evidence into a decision-ready pack. August Research does not own the laboratories or field facilities used for this work.
Stage | Illustrative delivery activity |
|---|---|
Week 1 | operating profile, surrogate-fluid agreement and provider selection |
Weeks 2–4 | cycling with scheduled flow and leakage checkpoints |
Week 5 | teardown and failure-hypothesis review |
Weeks 6–7, if required | targeted confirmation and handover |
Illustrative Outputs
- Specimen-level drift traces and exception log
- Configuration comparison organised by flow, pressure, leakage and seal condition
- Failure-hypothesis register with actions for engineering and suppliers
- Field-pilot recommendation with explicit evidence boundaries
Note:
This is a hypothetical illustrative engagement, not a client outcome. Sample counts, cycle counts, measurements, timing and possible outputs are conditional on the product, relevant standards, provider availability, specimen readiness, logistics and project scope. Accredited testing, regulatory interpretation and any formal conformity assessment remain the responsibility of appropriately qualified providers and responsible parties.
Research and Regulatory Context
Numerical values are illustrative. A real programme would agree the fluid, pressure range, temperature, sample count and acceptance limits with the client and the selected external provider.
Let’s Discuss Your Project
Tell us the product stage, expected service conditions, known failure concerns and the decision you need to make. We can shape an independent reliability evidence programme around the right facility, equipment and delivery route.
Illustrative timeline
This example is shown as 5–7 weeks. The actual timetable depends on external provider response times, equipment access, specimen availability, testing duration and any required approvals.