R&D & INNOVATION / SECONDARY RESEARCH
Innovation Landscape Mapping
See how innovation moves from research to adoption, and where your organisation can participate.
CHALLENGES
PATHWAYS
PARTICIPANTS
CONNECTIONS
INTERVENTIONS
Innovation rarely advances through one organisation
Promising technologies can emerge from universities, startups, suppliers, consortia or established manufacturers. Their progress may depend on investment, testing infrastructure, standards, manufacturing capacity, regulatory acceptance and an early customer willing to validate the solution. Looking at these elements separately can hide how the innovation system actually functions.
Innovation Landscape Mapping reconstructs that system around a defined technical challenge, application or industry transition. It shows which innovation pathways are being pursued, who contributes critical capabilities, how participants are connected, where activity is concentrated and where promising work becomes blocked before adoption.
THE CENTRAL QUESTION How does innovation move through this ecosystem, and where can the client intervene most effectively?
Questions this service is designed to answer
- Which scientific, technical and business pathways are addressing the defined challenge?
- Who creates knowledge, develops solutions, validates performance, enables scale and adopts the innovation?
- Which relationships, geographic clusters and shared programmes are shaping progress?
- Where are capabilities duplicated, concentrated, missing or disconnected?
- Why are some innovations moving towards implementation while others remain in research or pilot stages?
- Should the client build capability, form a partnership, license, invest, join a consortium or monitor the ecosystem?
A different question from adjacent services
Service | Principal question |
|---|---|
Technology Landscape Analysis | What solutions, architectures and technical pathways exist? |
R&D Trend Analysis | Where is research and innovation activity moving? |
Innovation Landscape Mapping | How do pathways, participants, capabilities and adoption conditions operate together? |
INNOVATION LANDSCAPE MAPPING / HOW THE RESEARCH IS EXECUTED
The Innovation System Reconstruction method
The research begins with a client decision and works outward. Technologies and organisations are not collected simply because they appear active. Each record must help explain a pathway, capability, relationship, translation stage or condition affecting the decision.
Research module | What is done |
|---|---|
1. Decision and system boundary | Define the challenge, application, value-chain position, geography, time window and decision to be supported. |
2. Innovation-system taxonomy | Structure problems, solution pathways, applications, participants, capabilities and translation stages. |
3. Participant and capability discovery | Identify organisations and resolve subsidiaries, spinouts, renamed companies, laboratories and institutional affiliations. |
4. Relationship reconstruction | Trace collaboration, licensing, investment, acquisition, pilot, grant, supply and standards relationships with dates and purposes. |
5. Translation-pathway analysis | Follow selected innovations through research, development, validation, scale-up and adoption, retaining stalled or discontinued routes. |
6. Bottleneck and intervention analysis | Identify dependencies, missing capabilities and entry points, then translate them into build, partner, license, invest, consortium or monitor options. |
MAPPING PRINCIPLE Activity does not equal progress. A dense publication, patent or startup cluster may still lack the testing, manufacturing, standards or customer pathway required for adoption.
INNOVATION LANDSCAPE MAPPING / EVIDENCE AND ANALYSIS
Evidence is connected by role, relationship and time
The study integrates evidence streams only where they help explain the innovation system. A patent identifies protected technical activity; a grant can reveal a development coalition; a pilot indicates validation intent; a standards committee may influence adoption; and a manufacturing announcement can show movement towards scale. No single signal is treated as proof of ecosystem strength.
Evidence stream | What it can reveal |
|---|---|
Scientific and technical records | Knowledge creators, methods, research clusters, technical problems and movement towards applied development. |
Patents and technology transfer | Protected capabilities, ownership, licensing routes, university spinouts and company-to-company technology movement. |
Grants, programmes and consortia | Public priorities, research coalitions, funded work packages, demonstration assets and geographic capability building. |
Investment, partnerships and M&A | Capital flows, strategic interest, capability acquisition, co-development and consolidation. |
Products, pilots and procurement | Validation settings, early customers, intended applications, deployment barriers and evidence of adoption. |
Regulation, standards and policy | Requirements, common interfaces, recognised methods, incentives, infrastructure programmes and timing constraints. |
Research access and source architecture
Research-access area | Conservative coverage range |
|---|---|
Technical and scientific databases | 50+ sources |
Patent and IP databases | 20+ sources |
Regulatory and standards sources | 30+ sources |
Industry, company and market-information sources | 40+ sources |
Language coverage through research capability | 15+ languages |
Curated taxonomies and internal evidence libraries | Continuously developed |
IMPORTANT CONTEXT The ranges communicate research access, not ownership of every database or a promise that every source will be used. The source architecture is selected for the project and documented with its limitations.
Framework context: WIPO describes innovation ecosystems through interacting businesses, universities, governments and investors.
Multi-signal precedent: OECD and EPO mapping of the global quantum ecosystem combines innovation, firm, investment, skills, trade and policy data.
INNOVATION LANDSCAPE MAPPING / OUTPUTS AND VALUE
What the output can look like
Output | Decision value |
|---|---|
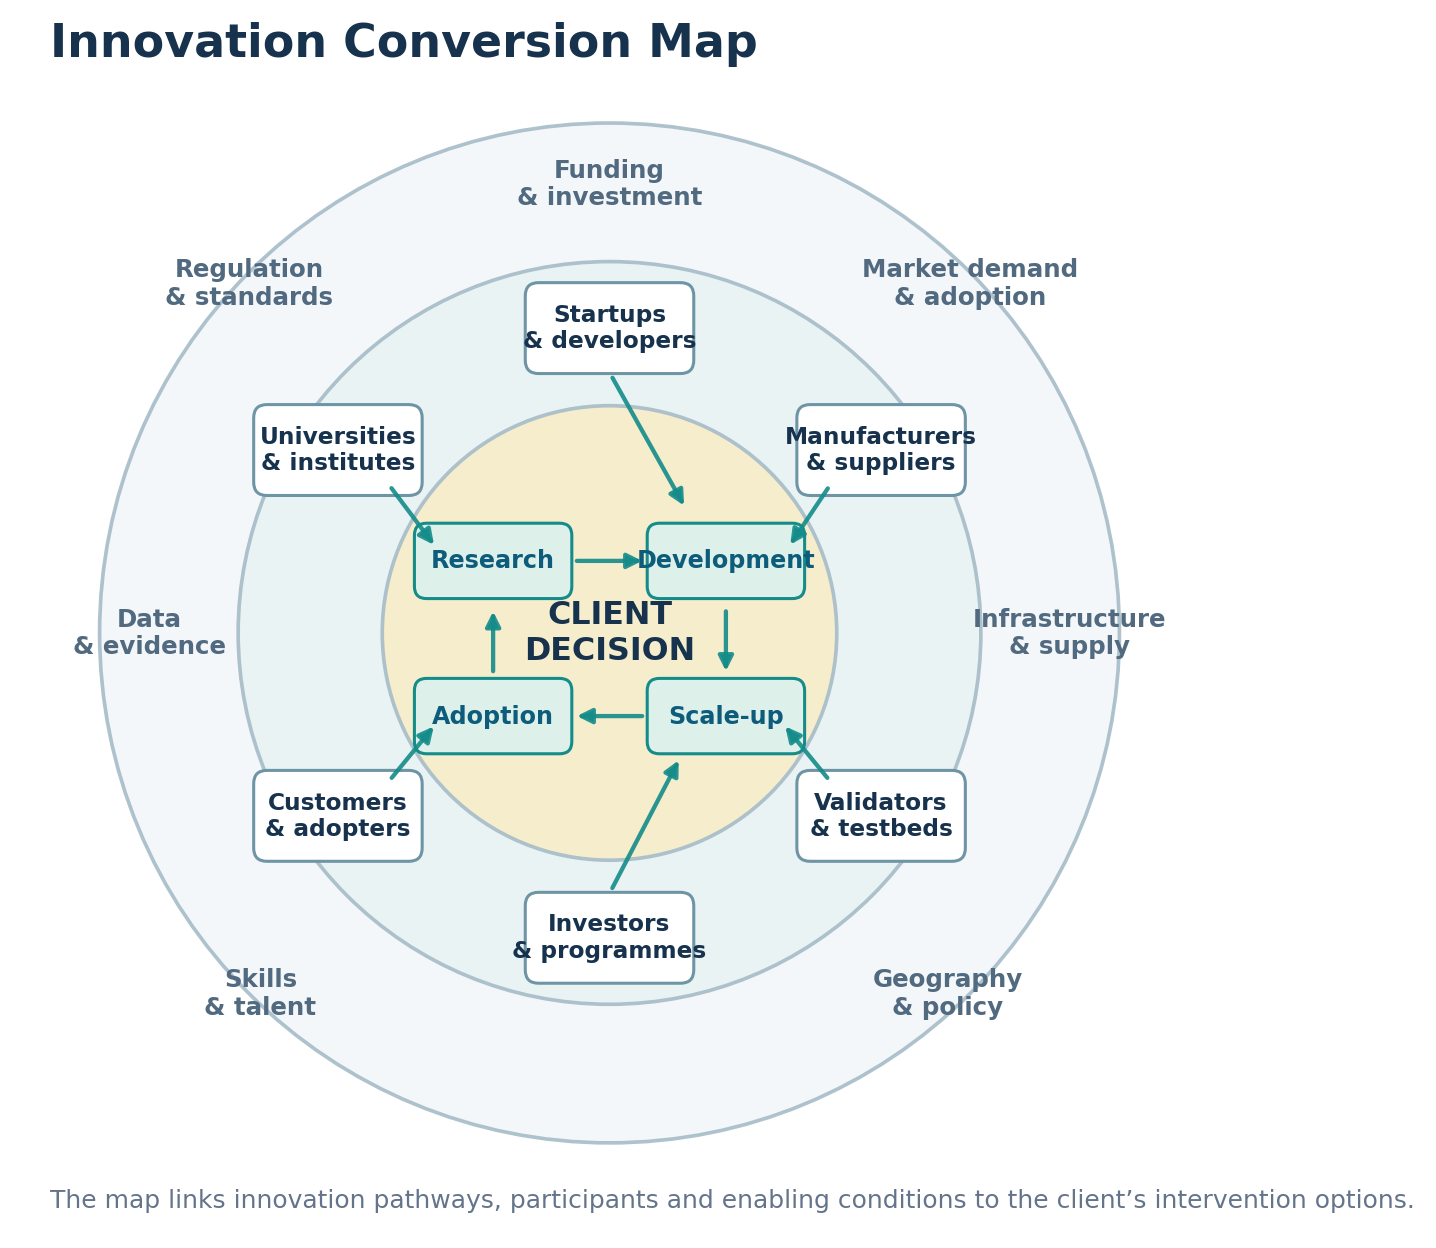
Innovation Conversion Map | Shows pathways, participants, capabilities, enabling conditions and movement from research towards adoption. |
Actor and capability database | Profiles roles, technical focus, assets, locations, relationships, activity status and evidence links. |
Collaboration and capital network | Reveals influential participants, recurring partnerships, investment pathways, consortia and disconnected clusters. |
Translation-pathway map | Shows where selected innovations are progressing, stalling, changing direction or becoming dependent on external capabilities. |
Dependency and bottleneck register | Identifies missing validation, manufacturing, infrastructure, standards, funding, skills or customer conditions. |
Client intervention options | Defines build, partner, license, invest, join-consortium and monitor routes with the evidence supporting each option. |
Why August Research
Many landscape services combine technologies, startups, patents and trends into a broad directory or dashboard. August Research reconstructs the system around the client’s decision. We distinguish participant role from activity volume, trace relationships to dated evidence, follow innovation through translation stages and expose the capability or adoption condition that may be preventing progress. The result is not simply a map of who appears in the space. It is a decision view of how innovation is being created, transferred, validated, scaled and adopted, and where the client has a credible route to participate.
Scope boundaries
Innovation Landscape Mapping is secondary research. It can identify ecosystem structure, relationships, visible capabilities and strategic intervention options, but it does not prove technical performance, confirm legal freedom to operate, establish regulatory approval, value a company, guarantee access to a participant or demonstrate that a partnership will succeed. Decision-critical uncertainties can be converted into focused primary research, technical validation or partner qualification.
Frequently combined with
- Technology Landscape Analysis
- R&D Trend Analysis
- Patent Landscape Research
- Regulatory & Standards Intelligence
- Technology Scouting
INNOVATION LANDSCAPE MAPPING / WEBSITE CONTENT
Example engagements
These five examples can appear as floating clickable placards. Each placard will open a separate Phase 2 page containing the full situation, methodology, analysis and output.
Industry | Example engagement | Decision preview |
|---|---|---|
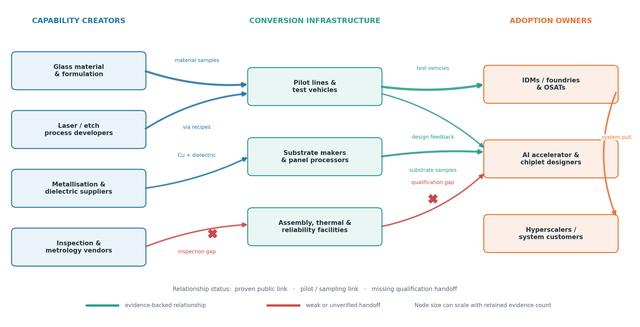
Semiconductors | Glass-core substrate ecosystem for advanced chip packaging | Which material, equipment, pilot-line, OSAT and standards capabilities must connect before high-volume adoption becomes credible? |
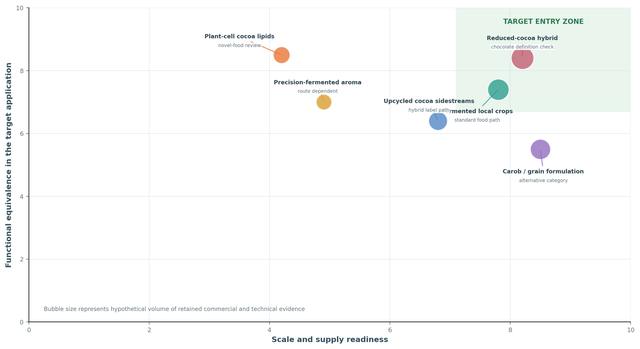
FMCG + Food Technology | Climate-resilient cocoa-alternative innovation ecosystem | How are fermentation, cell-culture, formulation, scale-up, food-regulatory and confectionery capabilities combining to address cocoa-supply pressure? |
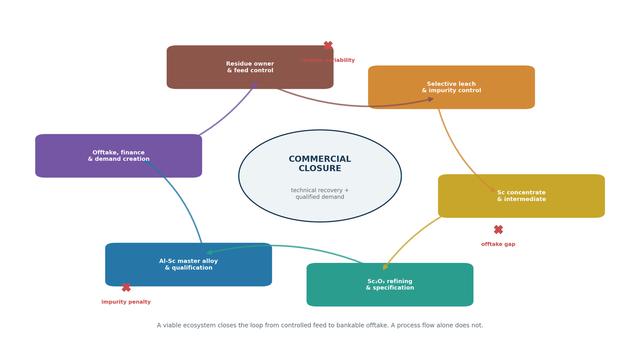
Mining + Raw Materials | Scandium recovery ecosystem around bauxite residue | Where are residue owners, separation developers, alloy producers, public programmes and aerospace adopters forming a viable conversion pathway? |
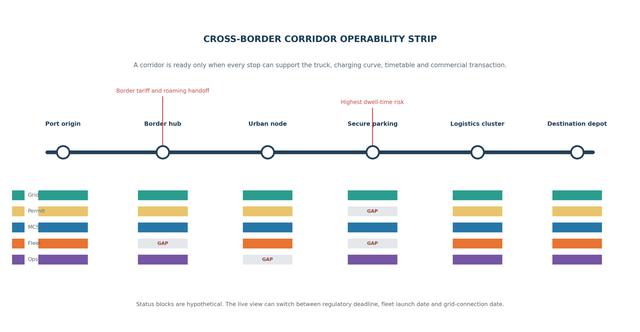
Commercial Transportation | Megawatt-charging ecosystem for cross-border electric freight | Which truck, charging, grid, depot, corridor, standards and logistics participants control deployment readiness? |
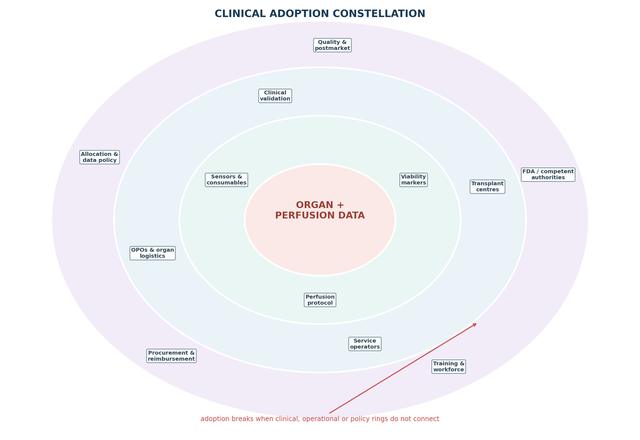
Medical Devices | Normothermic organ-perfusion innovation ecosystem | How do device developers, transplant centres, logistics providers, clinical evidence, reimbursement and regulatory capabilities influence adoption? |
Website presentation suggestion
Present the service as an interactive Innovation Conversion Map rather than another linear process. The visitor starts with a technical challenge and selects a pathway to reveal its participants, capabilities and relationships. Filters can switch between Research, Development, Validation, Scale-up and Adoption. Separate views can show where progress stops and where the client could build, partner, license, invest, join a consortium or monitor. On mobile, use expandable pathway cards.
Frequently asked questions
Question | Answer |
|---|---|
Is this a startup map? | No. The work can also map universities, suppliers, manufacturers, investors, testbeds, adopters, agencies and standards bodies. |
How long can a project take? | A focused map may take approximately four to six weeks. A broad multi-region ecosystem may require seven to twelve weeks. Timing depends on scope, source access and relationship depth. |
Let’s discuss your innovation system
If your team can see promising activity but cannot yet see how the participants, capabilities and adoption pathway fit together, August Research can build the map around the decision you need to make.
NOTE: The examples, timelines and output concepts are hypothetical. A live engagement would use a project-specific boundary, source architecture, evidence cut-off date and interpretation framework. Findings remain conditional on the available secondary evidence.