MARKET & BUSINESS INTELLIGENCE | SECONDARY RESEARCH
Market Sizing & Forecasting
Build a market number that can be traced, challenged and updated.
A decision model, not a borrowed market figure
Published market estimates often appear precise while measuring different products, value-chain levels, geographies or years. August Research builds the market from an explicit commercial boundary, reconciles independent evidence routes and forecasts the mechanisms that can change demand.
QUESTIONS ANSWERED How large is the market now? Which portion is commercially addressable? Which segments or countries contribute to growth? What would cause the forecast to move above or below the base case?
What this service supports
- Investment cases, growth plans and board-level market assumptions
- Product, capacity and geographic expansion decisions
- TAM, SAM and serviceable opportunity definitions
- Market models for narrow, fragmented or privately held sectors
- Forecast refreshes when regulation, pricing, capacity or adoption changes
WHY INDEPENDENT RESEARCH An external model can challenge the target number already embedded in an internal plan, compare evidence beyond the sales pipeline and document assumptions without protecting a preferred outcome.
AUGUST RESEARCH APPROACH The service is built around the Evidence-Balanced Market Model: one market boundary, several independent calculation routes and a forecast linked to observable drivers.
THE CHALLENGE
The hardest part is defining what is being counted
Two reports can use the same market label and still produce incompatible answers. Before calculating anything, the study fixes the economic object being measured and the rules that determine whether a revenue, unit, asset or transaction belongs inside the market.
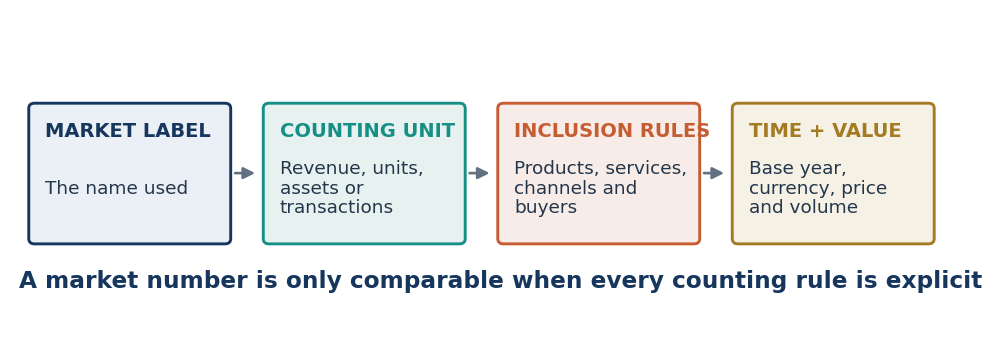
Why market estimates diverge
01 Product boundary: Adjacent products, services, aftermarket revenue or bundled components are included inconsistently.
02 Value-chain level: Manufacturer revenue, distributor sales and end-user spend can describe the same flow at different values.
03 Coverage: Private companies, local suppliers, informal channels or project-based sales may be missing.
04 Time and price: Base years, currency conversion, inflation, discounting and list versus realised prices are mixed.
05 Counting logic: Installed base, annual shipments, replacement demand and recurring revenue are treated as interchangeable.
06 Double counting: Reseller revenue, integrated systems and overlapping segments can be added more than once.
BOUNDARY RULE Every engagement produces an inclusion and exclusion ledger before the base-year estimate. A forecast cannot repair a boundary error.
CORE METHODOLOGY
The Evidence-Balanced Market Model
The model preserves the logic behind every number. It does not average conflicting estimates or apply a published CAGR to a new market definition. Each stage leaves an auditable decision trail that can be reviewed and updated.
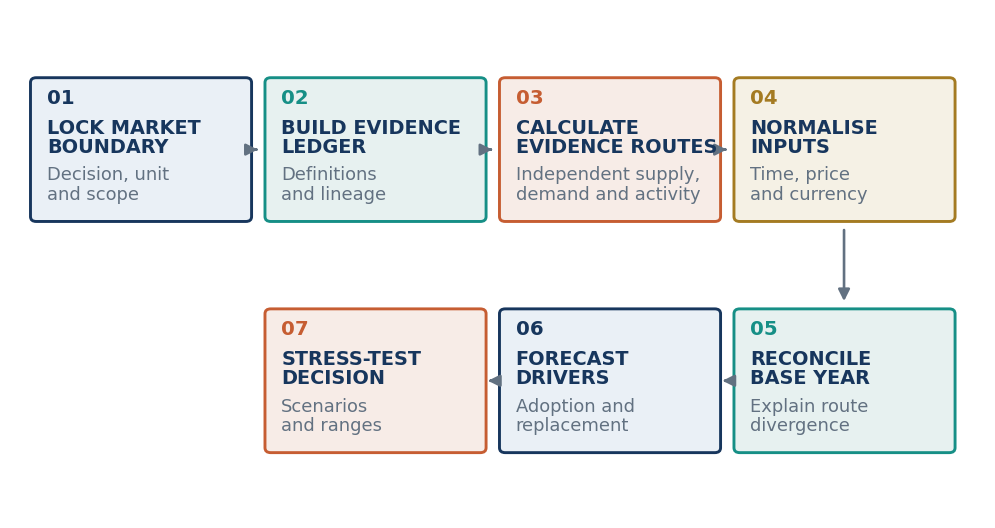
What makes the approach distinctive
- Independent calculation routes remain visible instead of disappearing into one unexplained estimate.
- Divergence is investigated as evidence of missing coverage, incompatible definitions or timing differences.
- Forecast drivers are inherited from the base-year model, keeping the historical and forward views connected.
- Assumptions carry a definition, date, transformation, dependency and confidence position.
- The client receives a range and decision logic when the evidence cannot support false precision.
DECISION PRINCIPLE The aim is not to force every evidence route to produce the same answer. It is to explain the remaining gap well enough that the client knows which number, range or scenario is appropriate for the decision.
BASE-YEAR SIZING ENGINE
Calculate through independent evidence routes
The routes are chosen around the natural unit of the market. A physical equipment market may be anchored to installed assets and replacement. A service market may be built from eligible accounts, utilisation and annual spend. A traded product may be checked through shipments, production and customs flows.
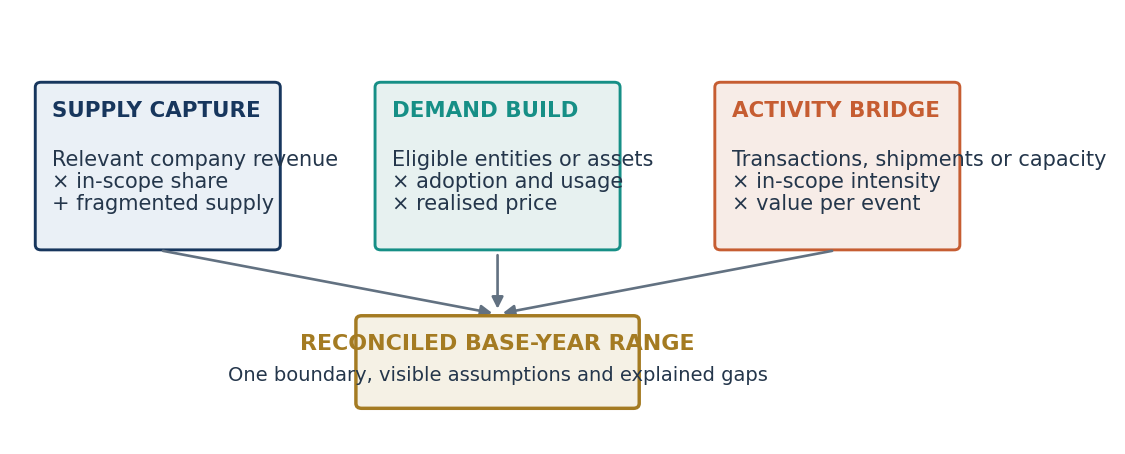
The evidence ledger
FIELD | WHAT IS RECORDED | WHY IT MATTERS |
|---|---|---|
Definition | The exact product, service, customer and value-chain meaning | Prevents unlike figures being compared |
Coverage | Companies, countries, channels, segments and missing population | Shows what the evidence can represent |
Time basis | Period, price basis, currency and conversion treatment | Creates a comparable base year |
Transformation | Allocation, exclusion, uplift, interpolation or index used | Makes adjustment logic reviewable |
Dependency | Whether inputs share the same underlying figure | Avoids false independent confirmation |
Confidence | Direct, derived, proxy or assumption-led evidence | Supports ranges and sensitivity tests |
Reconciliation is a diagnosis, not an average
If the supply route exceeds the demand route, the model tests channel inventory, exports, adjacent revenue, utilisation and fragmented buyers. If the demand route is higher, it tests missing suppliers, service revenue, private-company coverage and unrecorded channels. Only explained adjustments enter the reconciled range.
FORECASTING ENGINE
Forecast the mechanisms, not an inherited CAGR
A historical growth rate describes what happened under the previous market structure. August Research forecasts from the variables that create future volume and value, then tests how timing and constraints change the result.
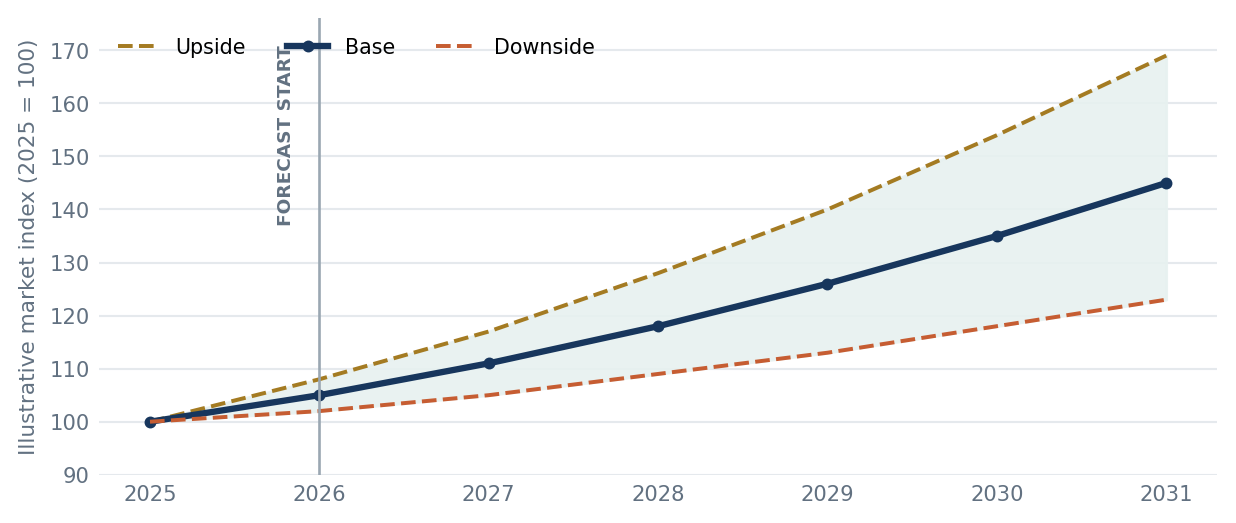
Forecast driver architecture
DRIVER FAMILY | EXAMPLES | HOW IT ENTERS THE MODEL |
|---|---|---|
Eligible base | Sites, users, assets, projects or transactions | Sets the population that can generate demand |
Adoption | Awareness, qualification, conversion and saturation | Controls how quickly the eligible base becomes active |
Replacement | Asset life, failure, upgrade and refresh cycles | Separates new demand from recurring demand |
Price and mix | Realised price, service share, premium mix and inflation | Separates value growth from unit growth |
Capacity and access | Supply, installation, skills, channels and infrastructure | Constrains growth that demand alone cannot deliver |
Timing events | Regulation, procurement cycles, incentives and project milestones | Moves demand between years and scenarios |
Scenario and uncertainty controls
- Base, upside and downside scenarios change defined drivers rather than applying arbitrary percentage spreads.
- Sensitivity testing identifies which assumption creates the largest movement in the forecast.
- Adoption ceilings, capacity limits and replacement timing prevent unconstrained exponential growth.
- CAGR is reported as an output of the model, with the start value, end value and compounding period visible.
FORECAST INTERPRETATION The deliverable explains why the market grows, what could delay that growth and which leading indicators should be monitored before the forecast is refreshed.
EVIDENCE AND DELIVERY
Evidence is selected to fit the model
No fixed database bundle can size every market. The evidence plan begins with the calculation routes and then selects the financial, trade, regulatory, company, product and operating information needed to populate them.
Database and information coverage
EVIDENCE GROUP | POTENTIAL COVERAGE | MODEL USE |
|---|---|---|
Company and financial | Company filings; S&P Capital IQ, FactSet, Bloomberg and Refinitiv where relevant | Revenue capture, segment allocation and company universe |
Investment and transactions | PitchBook, disclosed funding, acquisitions and project announcements | Entry, capacity and commercial momentum signals |
Trade and public statistics | UN Comtrade, national statistics, customs, World Bank, IMF, OECD and Eurostat | Shipments, production, macro drivers and geographic checks |
Market and industry | Relevant paid market databases, associations, procurement records and sector datasets | Definitions, asset counts, pricing and cross-checks |
Company and product | Product catalogues, price evidence, channel listings, tenders and installed references | Portfolio mapping, realised scope and bottom-level inputs |
The final source mix depends on the market definition, data rights and the calculation route. Database access is applied selectively rather than presented as a substitute for modelling.
What the client receives
- Market definition, inclusion rules and segment taxonomy
- Base-year and historical market model with visible calculation routes
- Forecast model with drivers, scenarios, sensitivities and CAGR outputs
- Evidence and assumption ledger with confidence positions
- Market dashboard covering size, growth, segments and geographies
- Executive decision briefing and an update framework for future refreshes
Engagement formats
FORMAT | BEST USED WHEN | OUTPUT EMPHASIS |
|---|---|---|
Decision estimate | A bounded commercial decision needs a directional range | Core boundary, independent checks and decision range |
Detailed market model | Investment, capacity or entry depends on segment-level evidence | Auditable sizing, forecast and scenario workbook |
Refreshable forecasting system | The market is changing and assumptions need periodic updates | Driver monitor, refresh logic and comparable time series |
AUGUST RESEARCH VALUE The client receives the logic behind the estimate, not only a headline number. The model can be challenged, revised and carried into the next decision.
APPLICATIONS
Illustrations
Each illustration begins with a real industry question and uses a different market model, evidence mix and forecast mechanism.
INDUSTRY | ILLUSTRATIVE QUESTION | LIKELY MODEL ANCHOR |
|---|---|---|
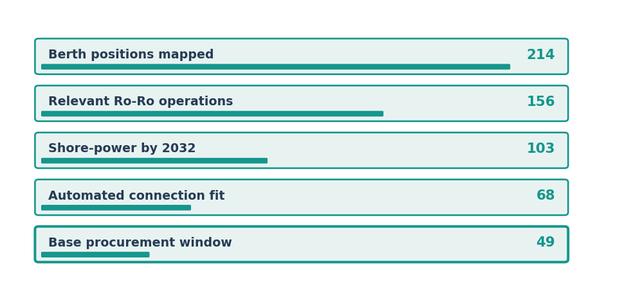
Maritime infrastructure | What is the addressable retrofit market for automated shore-power connection systems at Mediterranean Ro-Ro berths through 2032? | Eligible berths, announced projects, retrofit timing and system value |
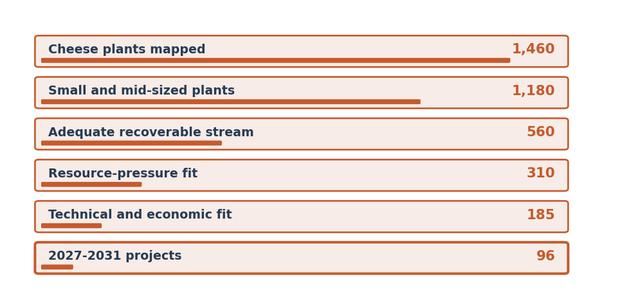
Food processing | How large is the serviceable EU market for whey concentration and water-recovery systems at small and mid-sized cheese plants? | Plant universe, whey stream, technical eligibility and project economics |
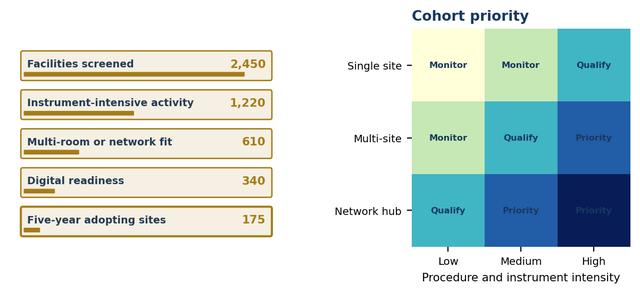
Healthcare operations | What is the five-year market for instrument tracking and sterilisation analytics among DACH ambulatory surgery centres? | Facility base, procedure intensity, digital eligibility and recurring revenue |
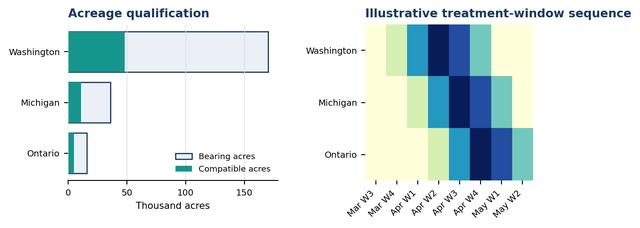
Specialty agriculture | What annual service demand could robotic apple thinning reach across Washington State, Michigan and Ontario by 2032? | Bearing acreage, serviceable orchard systems, treatment windows and price per acre |
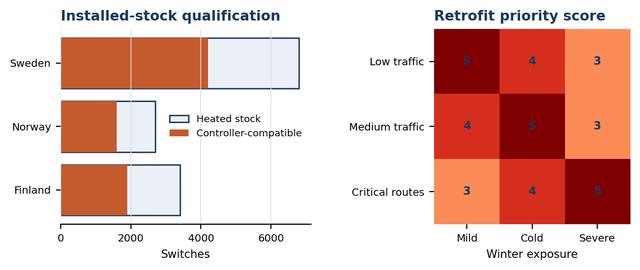
Rail infrastructure | What is the retrofit demand for energy-efficient switch heating across Sweden, Norway and Finland? | Heated switch stock, replacement cycle, climate exposure and procurement timing |
FAQ
Can August Research size a market with no published total? Yes. The model can be built from companies, assets, buyers, transactions, capacity or another observable unit, provided the boundary and assumptions are explicit.
What happens when published estimates disagree? We normalise the definitions, trace dependencies and test the causes of divergence. Conflicting figures are not simply averaged.
Can the service calculate TAM, SAM and SOM? Yes. Each layer receives its own eligibility and access rules so the serviceable opportunity is not a percentage chosen after the total market is calculated.
Is primary research required? No. This service is designed around existing information. If a critical assumption cannot be supported, a separate primary-research module can be considered rather than hidden inside the model.
How precise is the forecast? Precision follows evidence quality. Where uncertainty is material, August Research provides ranges, sensitivities and scenario conditions instead of unsupported decimal accuracy.
CONTACT US Tell us which market decision the model must support, what is currently being counted and where existing estimates fail to agree. August Research will design the market boundary, evidence routes and forecast around that decision.