R&D & INNOVATION / SECONDARY RESEARCH
R&D Trend Analysis
A disciplined view of where technical momentum is building, what is still only a weak signal, and what your R&D team should do next.
DECISION USE
Set roadmap priorities, direct scouting and focus validation or partnership work.
EVIDENCE LENSES
Science, IP, translation and context signals interpreted together.
DELIVERY STYLE
Signal horizon, evidence cards and action lanes that can be refreshed.
When the question is not simply “what is new?”
R&D leaders are often surrounded by announcements, publications, patents and vendor claims. The harder task is deciding whether a change reflects sustained technical momentum, an application-specific opening, a regulatory response, or a short-lived burst of attention. R&D Trend Analysis is designed to make that distinction visible.
The service turns a defined technical question into a time-based evidence system. It shows what is established, what is accelerating, what is emerging and what should remain on a watchlist. It also records the operating conditions, evidence gaps and contradictions behind each interpretation, so that a trend is never treated as a conclusion in itself.
Questions this service is designed to answer
DIRECTION
Which technical routes are gaining meaningful momentum in our defined space?
INFLECTION
What has changed recently in the science, patent, pilot, product or standards evidence?
RELEVANCE
Which signals matter for our application, operating boundary and development stage?
ACTION
What should we explore now, build evidence around, monitor or deliberately deprioritise?
UNCERTAINTY
Where is the evidence thin, contradictory or based on unverified claims?
TIMING
What signs would indicate that a watchlist topic has become decision-relevant?
How the trend evidence system is executed
The work begins by agreeing the technical boundary and the decision horizon. August Research then builds a client-specific taxonomy, captures dated evidence records, removes duplication and weakly supported repetition, and looks for patterns across independent source families. The final stage converts the pattern into a practical action lane rather than a generic “high-potential” score.
Define the decision, applications, technical inclusions and exclusions, geographies, time window, baseline technology and the signs that would change an R&D decision.
Search and structure dated records across selected scientific, IP, company, pilot, product, partnership, standards and regulatory sources. Each record is coded to the agreed taxonomy and source provenance.
Normalise duplicate or related records, separate activity from corroborated progress, check source independence, and analyse movement over time by technical route, application and geography.
Interpret the patterns against technical fit, scale-up and integration constraints, competitive activity and external drivers. Place each topic into action, build-evidence, monitor or watchlist lanes with explicit confidence notes.
The research controls behind the horizon
A signal only becomes useful when its provenance and context are clear. The evidence architecture is set at the outset and adjusted to the topic. A materials question may place more weight on formulation, process and qualification evidence; a medtech question may require clinical, standards and regulatory records; a robotics question may need operating-environment and deployment evidence.
TECHNICAL TAXONOMY
Mechanism, material, component, process, performance attribute and application.
TIME CODING
Publication, priority, announcement, pilot, launch and regulatory dates kept distinct.
SOURCE TRIANGULATION
Repeated claims are not counted as independent support without corroboration.
CONFIDENCE NOTES
Evidence strength, assumptions, gaps and contradictory signals retained in the record.
Observable trend indicators reviewed in secondary research
The exact signal inventory is selected for the technology and decision. We then date-code the records and examine their rate of change, persistence, geographic spread and convergence across independent sources. This prevents the analysis from treating a single announcement as a trend.
SCIENTIFIC OUTPUT
Peer-reviewed papers, preprints, cited technical studies and conference proceedings.
PATENT ACTIVITY
New filings, family growth, claim focus, citations, assignees and geographic extension.
CONFERENCE SIGNALS
Abstracts, keynote themes, technical sessions, exhibitor presence and demonstration activity.
STANDARDS + POLICY
Committee work, draft standards, test methods, guidance, restrictions and incentive changes.
PRODUCT LAUNCHES
New products, product revisions, published specifications and application claims.
PILOTS + QUALIFICATION
Pilots, prototypes, demonstrators, customer trials, validation and qualification evidence.
PARTNERSHIPS
Joint development, licensing, supply agreements, university collaboration and consortium activity.
CAPACITY + SCALE-UP
Pilot lines, manufacturing investment, plant announcements, equipment orders and scale-up claims.
FUNDING + GRANTS
Venture rounds, strategic investment, public grants and programme awards.
M&A + PORTFOLIO MOVES
Acquisitions, divestitures, corporate venture activity and portfolio expansion or repositioning.
ECOSYSTEM ACTIVITY
New entrants, supplier availability, specialist service providers, talent movement and value-chain participation.
DEMAND + ADOPTION
Customer requirements, tenders, procurement signals, adoption announcements and replacement activity.
RATE OF CHANGE
Acceleration, deceleration, recurrence and the duration of a signal over the selected time window.
TECHNICAL ADVANCE
Evidence of change in performance, reliability, manufacturability, cost or integration.
APPLICATION FIT
Evidence that the development addresses a priority use case, operating condition or unmet technical need.
EVIDENCE QUALITY
Source provenance, independence, recency, technical specificity and strength of corroboration.
What clients receive
The work normally separates the working evidence base from the decision narrative. This allows scientists and engineers to inspect the coded records while leadership teams use a concise view of momentum, timing and required actions.
A structured spreadsheet or database with source links, dates, technical tags, application mapping, organisation fields, signal type, confidence notes and an audit trail for interpretation.
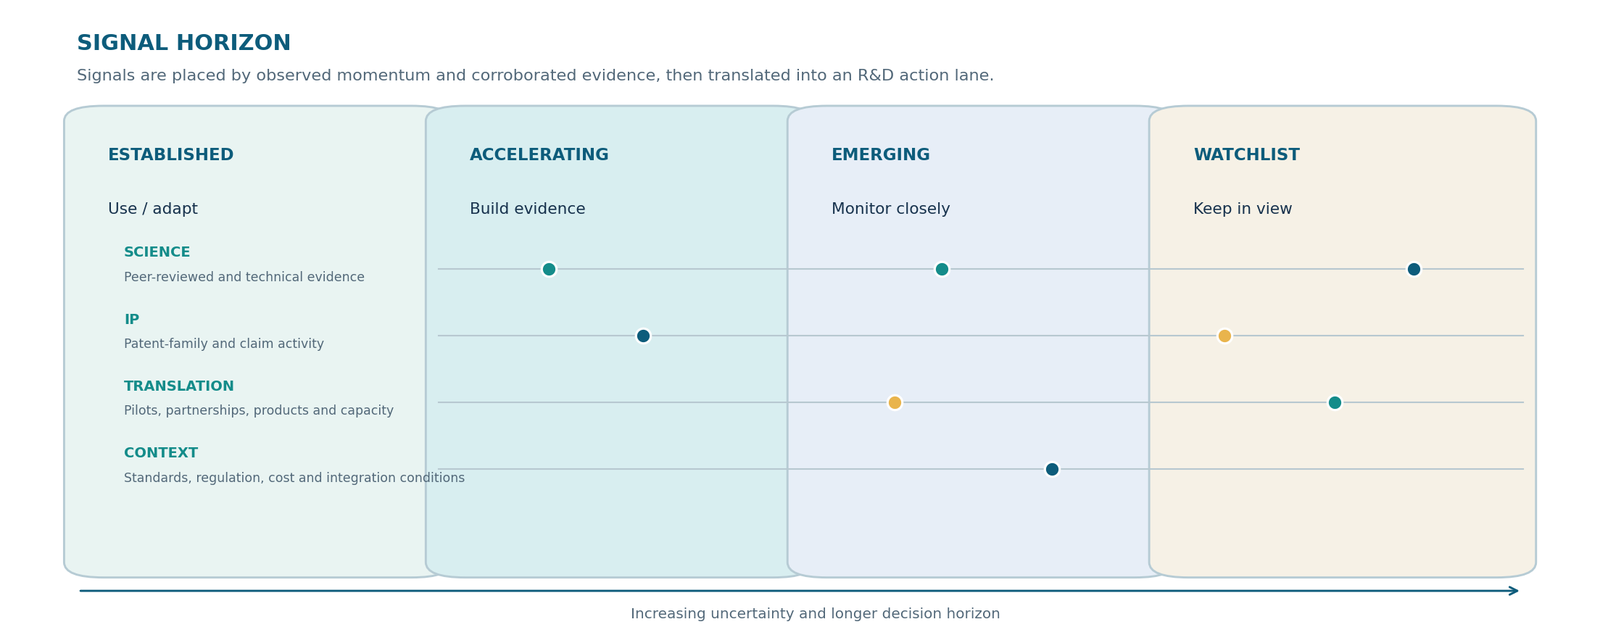
A visual horizon placing themes in established, accelerating, emerging and watchlist zones. Each trend card explains the evidence pattern, relevance, constraints, trigger to reassess and the recommended action lane.
A presentation or written brief setting out key inflections, technical implications, topics to advance or monitor, uncertainties and a proposed refresh cadence.
Why August Research
Many trend-intelligence offerings emphasise broad signal dashboards, content feeds or pre-defined sector categories. August Research starts with the technical decision and then creates the evidence structure needed to support it. The result is not a catalogue of mentions or an abstract foresight exercise. It is a traceable view of changing technical momentum, tied to the client’s application, constraints and next decision.
TECHNICAL CONTEXT FIRST
A signal is assessed against a defined technical taxonomy and operating environment before it is considered strategically relevant.
MOMENTUM, NOT VOLUME
Activity is interpreted through dated, corroborated events. A high number of documents alone does not create a high-confidence trend.
ACTIONABLE UNCERTAINTY
Contradictions and evidence gaps are retained, with clear triggers for when a team should investigate, validate or revisit a topic.
Scope boundaries
R&D Trend Analysis is secondary research. It can identify evidence patterns and help prioritise technical questions, but it does not prove laboratory performance, guarantee market adoption, establish legal freedom to operate or provide regulatory approval advice. When a signal becomes important but the evidence remains incomplete, the output identifies the focused work that may require expert input, testing, validation or legal and regulatory review.
Frequently combined with
- Technology Landscape Analysis
- Scientific Literature Review
- Patent Landscape Research
- Emerging Technology Assessment
- Regulatory & Standards Intelligence
Website presentation suggestion
Present the service through a living signal horizon, rather than a conventional radar. On desktop, a visitor can switch between the science, IP, translation and context tracks to reveal why a topic has been positioned in its current horizon zone. Selecting a signal opens a short evidence card with the decision relevance, confidence note and reassessment trigger. On mobile, use a stacked time horizon with expandable signal cards. This makes the method immediately legible without suggesting that the output is an automated prediction tool.
Designed to support a continuing R&D conversation
A completed study can become a practical monitoring baseline. The client decides which themes merit a regular refresh and which event types should trigger an earlier review, such as a new patent family, a pilot announcement, a standards milestone, a material qualification result or a relevant regulatory change. This keeps the team focused on the evidence that could genuinely change a technical decision.
Example engagements
These example briefs can appear as floating clickable placards on the service page. Each placard leads to a separate, detailed example page.
INDUSTRY | EXAMPLE ENGAGEMENT | DECISION PREVIEW |
|---|---|---|
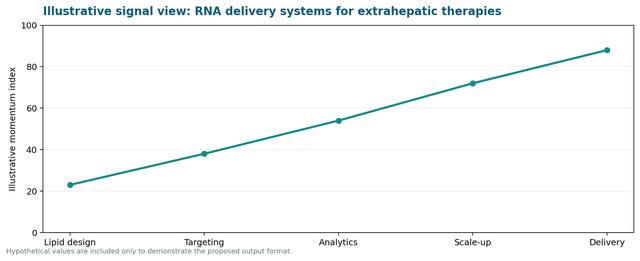
Biotech + Pharma | Next-generation RNA delivery systems | Which changes in lipid chemistry, targeting, formulation and manufacturing are showing enough corroborated momentum to influence a future platform roadmap? |
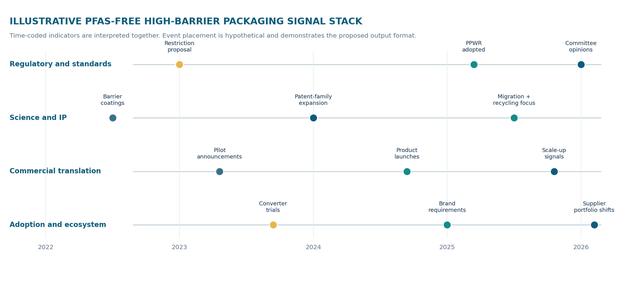
FMCG + Chemicals | PFAS-free high-barrier packaging | Which coating and substrate approaches are moving from regulatory response to technically credible performance options for food and consumer packaging? |
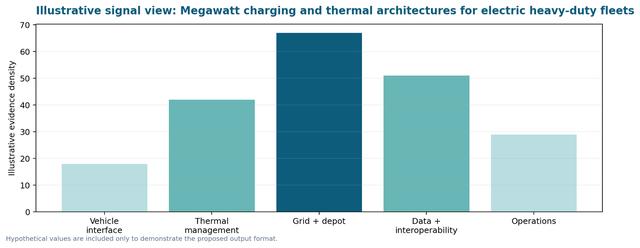
Commercial Vehicles + Transportation | Megawatt charging and thermal architectures | Which charging, connector, cooling and energy-management trends are becoming relevant for high-duty electric fleets and depot infrastructure? |
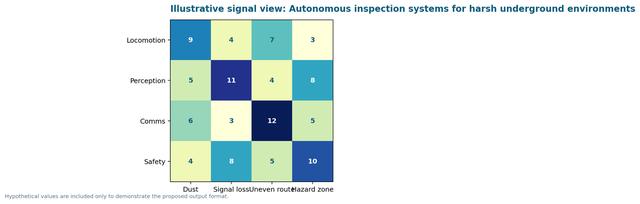
Mining + Robotics | Autonomous inspection in harsh underground environments | Which sensing, locomotion, communications and autonomy capabilities are progressing from demonstrations toward repeatable operating use? |
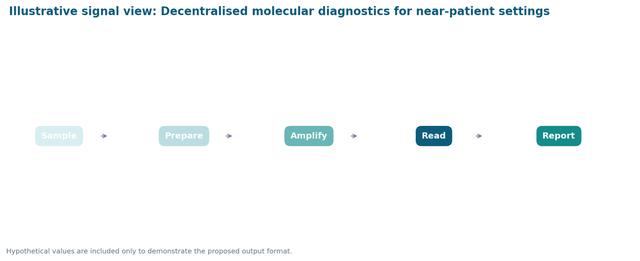
Medical Devices + Diagnostics | Decentralised molecular diagnostics | Which sample-preparation, assay, cartridge and reader innovations are building evidence for intended-use expansion outside central laboratories? |
Note: These are hypothetical engagement concepts for website illustration, not client engagements or research findings. The precise source mix, scope, timeline and output would depend on the technical question and availability of relevant evidence.
PLACARD DESIGN
Show each placard with an industry label, title and one-line decision question. Use staggered placement along a subtle horizon line on desktop, with a compact carousel or vertical stack on mobile. Each must open its own detailed example page.
Frequently asked questions
How is this different from Technology Landscape Analysis?
A Technology Landscape Analysis maps the breadth of a defined technology space, including pathways, applications and participants. R&D Trend Analysis focuses more tightly on directional change over time and the practical signals that should alter an R&D team’s attention or roadmap.
How is this different from Emerging Technology Assessment?
Trend analysis monitors and interprets a set of changing signals. An Emerging Technology Assessment is a deeper evaluation of a selected technology or small set of options against readiness, fit, risks and decision criteria.
Can the analysis focus on a very narrow technical issue?
Yes. It can be scoped around a mechanism, material, process step, component, performance challenge or intended-use setting, provided there is a clear decision question and time horizon.
Can the work be refreshed?
Yes. The taxonomy, evidence controls and signal cards can be reused for a focused quarterly, semi-annual or event-led refresh. The appropriate cadence depends on the rate of change in the topic.
How long can a study take?
A focused study may take around three to five weeks. A broad, multi-technology or multi-region trend system may take six to ten weeks. Timing is illustrative and depends on the scope, evidence accessibility and depth of required interpretation.
Let’s discuss your R&D question
If your team needs a clearer view of what is changing in a technical space and what that change should mean for the roadmap, August Research can design the trend evidence system around the decision in front of you.