PRIMARY RESEARCH | PRODUCT PERCEPTION STUDIES
Product Perception Studies
Understand what a product communicates, which cues shape that meaning and how perception changes the market decision.
A product does not communicate only what its developer intended
People interpret materials, design, claims, price, packaging, demonstrations, evidence and experience through their own category expectations. Product Perception Studies show where the intended signal survives, changes or disappears.
From product signal to decision
INTENDED SIGNAL
What the company expects the product to communicate
MARKET MEANING
What the participant actually infers and believes
DECISION EFFECT
What changes trial, specification, purchase or rejection
What this service helps clients decide
POSITION
Which meaning should lead?
PROVE
Which claim needs stronger evidence?
REDESIGN
Which cue creates the wrong expectation?
SEGMENT
Whose interpretation changes the action?
Product perception is not a popularity score
The research does not stop at positive, negative or preferred. It identifies what participants think the product is, what they expect it to do, why they believe that interpretation and what the perception makes them more or less willing to do.
Scope, participant count, markets and timing are agreed after the product decision, stimulus readiness, audience incidence, confidentiality and field access are understood. No fixed sample is implied before feasibility is confirmed.
02 | PERCEPTION AUDIENCES
One product can produce several legitimate perceptions
Participants are selected because they encounter, evaluate, buy, implement or represent the product in a way that matters to the decision.
Whose perception should be evaluated?
VIEWPOINT | RELEVANT PARTICIPANTS | WHAT THEIR PERCEPTION REVEALS |
|---|---|---|
EXPERIENCE | Current, lapsed and competitor-product users | Experienced usefulness, quality, performance and promise-to-experience gaps |
CONSIDERATION | Prospects, category users and informed non-users | Immediate relevance, differentiation, expected benefit and rejection cues |
PURCHASE | Buyers, procurement, budget owners and category managers | Value, commercial credibility, risk and evidence required to justify purchase |
ADOPTION | Operators, installers, service and implementation roles | Practicality, support burden, fit with work and confidence in adoption |
MARKET | Distributors, specifiers, advisers and channel partners | Explainability, sellability, recurring objections and market fit |
Selection parameters
RELATIONSHIP
Current, prospective, lapsed, rejecter or competitor user
DECISION ROLE
User, buyer, operator, specifier, channel or service
EXPOSURE
Unaware, aware, evaluated, trialled or experienced
CONTEXT
Geography, language, channel, occasion and environment
CATEGORY
Familiarity, price tier, alternative used and switching history
PRODUCT STATE
Concept, prototype, finished product or market version
ACCESS
Device, site, product handling, travel and accessibility needs
CONFLICT
Commercial relationship, confidentiality and incentive boundaries
How participants can be reached
Access may combine client-approved customer lists, targeted professional recruitment, consumer panels, product-user communities, channel referrals, retail or field intercepts and market-specific recruitment partners. The route is selected around incidence, relationship sensitivity, geography and the product exposure required.
WHY INDEPENDENT RESEARCH ADDS VALUE
Neutral recruitment and moderation reduce courtesy bias, separate product evidence from sales explanation and make it easier for participants to express doubt without affecting a customer, supplier or employer relationship.
03 | STIMULUS ARCHITECTURE
Control what participants encounter before asking what it means
A perception finding is only interpretable when the product cue, information, sequence and context that produced it remain visible.
What participants may be shown
STIMULUS STAGE | EXAMPLES | CONTROL QUESTION |
|---|---|---|
CONCEPT | Need statement, proposition, product idea or use situation | What can be inferred before the product is seen? |
EXPRESSION | Name, visual, package, listing, specification or claim | Which signals set expectation before use? |
ENCOUNTER | Prototype, sample, demonstration, handling or guided trial | What changes after direct exposure? |
EVIDENCE | Performance data, certification, warranty or proof explanation | What becomes more credible and what remains doubtful? |
COMPARISON | Alternative version, current product or category reference | Does the product create meaningful differentiation? |
Exposure choices are part of the methodology
BLIND OR OPEN
Separate the product experience from brand, price or supplier influence.
MONADIC OR SEQUENTIAL
Evaluate one version alone or reveal versions in a controlled order.
IMMEDIATE OR DELAYED
Capture first meaning, learning through use and what remains later.
CENTRAL OR IN CONTEXT
Use a controlled venue, workplace, retail setting, home or field environment.
STATIC OR INTERACTIVE
Show a concept or allow handling, setup, demonstration or product use.
SINGLE OR MULTI-ROLE
Keep one audience independent or follow meaning across a buying and adoption system.
Stimulus integrity
CONSISTENCY Instructions, exposure time, product version, language and evidence are controlled so segment differences are not created by the research setup.
TRACEABILITY Every finding remains linked to what the participant had seen and experienced at that point.
CONTEXT Reviews, customer-support records and category information may inform the stimulus and questions, but they do not replace direct perception evidence.
04 | METHODOLOGY
The Cue-to-Meaning Perception Framework
The framework follows the path from an observable product signal to a belief, confidence level and market action.
The perception formation path
1 CUE
What was noticed?
2 MEANING
What did it suggest?
3 PROOF
Why was it believed?
4 CONFIDENCE
How certain was it?
5 ACTION
What changed next?
How the research is carried out
FRAME THE PRODUCT DECISION Define the product, market action and perception uncertainty that management needs to resolve.
BUILD THE VIEWPOINT SAMPLE Select the participant relationships and decision roles capable of revealing that uncertainty.
CALIBRATE THE STIMULUS Control what is shown, in what sequence, with which comparison and in which environment.
CAPTURE UNPROMPTED MEANING Record first interpretation before rating scales, explanations or brand language narrow the response.
TEST EVIDENCE AND CONFIDENCE Introduce use, proof, price or alternative cues and observe which beliefs strengthen, weaken or change.
CONNECT PERCEPTION TO ACTION Compare audience patterns and identify what the client should clarify, prove, redesign, retain or test next.
A DIAGNOSTIC METHOD, NOT A WINNER SCORE
Positive and negative ratings are treated as signals to investigate. The output shows which cue created the meaning, for whom, with what confidence and with what consequence for the product decision.
05 | FIELDWORK DESIGN
Select the field method around the way perception forms
No fixed interview, survey or product-test bundle is applied to every engagement.
FIELD METHOD | USE WHEN | EVIDENCE CAPTURED |
|---|---|---|
First-impression interpretation | Early product expression, proposition or unfamiliar category | Spontaneous associations, category placement and expectation |
Controlled comparative exposure | Alternative products, claims, evidence or presentations must be separated | Meaning changes caused by each controlled cue |
In-context product encounter | Handling, demonstration, trial or environment shapes judgement | Perception before, during and after the encounter |
Multi-role B2B evaluation | Users, buyers, operators and channel roles interpret the same offer differently | Role-specific value, risk, proof and adoption meaning |
Perception quantification | Qualitative cues must be measured across defined segments or markets | Prevalence, divergence, confidence and decision thresholds |
Questions are grounded in what the participant has encountered
EXAMPLE BACKGROUND
You have seen the product presentation, handled the sample and reviewed the evidence available to a buyer at this stage. Please respond only from the information and experience provided.
NOTICE What did you notice before you began looking for information?
INTERPRET What does this product appear designed to help someone do?
BELIEVE Which part made the performance claim feel credible or doubtful?
ACT What would you do next, and what would still prevent that action?
Evidence is triangulated
Observed attention and handling show what happened. Short physical or online forms create comparable signals. Interviews and task reconstruction explain why. Segment and role comparisons show whether the perception belongs to one participant, one audience or a wider market pattern.
06 | DECISION OUTPUTS
From product meaning to product action
The analysis makes the gap between intended communication and market interpretation usable by product, marketing, commercial and innovation teams.
Core analysis views
SIGNAL GAP
Intended versus interpreted
SEGMENT GAP
Who reads the cue differently
PROOF GAP
What remains unconvincing
EXPERIENCE GAP
Promise versus encounter
ACTION GAP
Meaning versus next step
What the client receives
PERCEPTION MAP
Audience associations, expectations, value and risk meanings
CUE-TO-MEANING MATRIX
The product signal behind each interpretation
SEGMENT CONTRAST
Differences by role, relationship, market or experience
CREDIBILITY REGISTER
Proof that strengthens or fails to shift belief
STIMULUS REPLAY
What each participant had seen when the meaning changed
PRODUCT DECISION BRIEF
What to clarify, prove, redesign, retain or test next
Why August Research
100+ INFORMATION CHANNELS
Company, customer, market and industry context across the wider research ecosystem
8 INDUSTRY GROUPS
Sector context used to shape product language, roles and evidence boundaries
MULTIPLE ACCESS ROUTES
Client contacts, targeted recruitment, panels, communities and market partners
MULTI-MARKET DESIGN
Comparable perception evidence across selected geographies, languages and channels
August Research combines product-specific participant design, controlled stimulus exposure, neutral moderation and sector context. The client receives the reasoning behind the perception, not a dashboard of unexplained scores.
Engagement formats
FOCUSED QUALITATIVE
One product question and a small number of priority audiences
Often 4 to 6 weeks
MIXED METHOD
Exploration followed by structured perception measurement
Often 6 to 9 weeks
MULTI-MARKET
Comparable exposure and analysis across selected markets
Often 8 to 12 weeks
Timelines are indicative and depend on participant incidence, recruitment response, product access, stimulus readiness, confidentiality, markets, languages and field permissions.
07 | ILLUSTRATIONS
Product perception questions across different markets
Each illustration would use a different exposure design, participant architecture, question sequence and evidence view according to the product decision.
PRODUCT QUESTION | PERCEPTION AUDIENCE | POSSIBLE FIELD APPROACH | EVIDENCE VIEW |
|---|---|---|---|
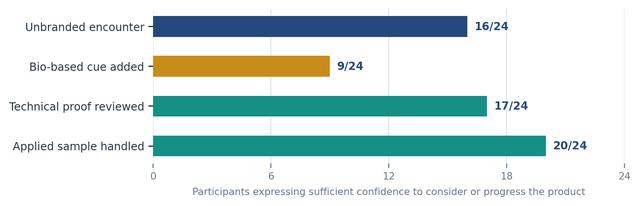
Bio-based facade sealant | Lombardy, Italy | Facade contractors, specifiers, distributors and procurement | Sequential cartridge, applied sample and technical-proof exposure | Cue-to-credibility map |
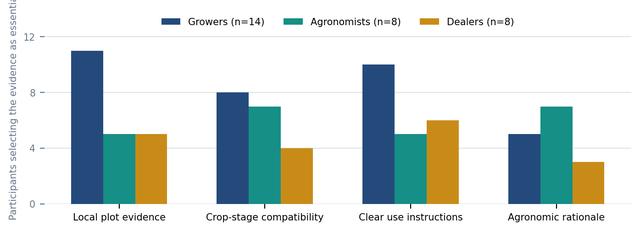
Foliar micronutrient concentrate | Nashik, India | Grape growers, agronomists and agri-input dealers | Role-separated product, label and evidence-threshold sessions | Proof threshold ladder |
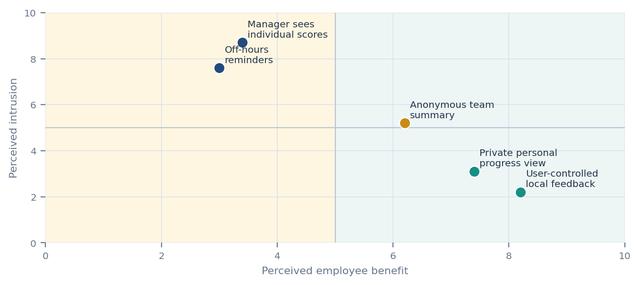
Wearable posture feedback clip | Toronto, Canada | Hybrid workers, occupational health advisers and HR buyers | Short-use placement with separate worker and buyer interpretation | Benefit-intrusion matrix |
Refurbished EV home charger | North Rhine-Westphalia, Germany | EV homeowners, installers and reseller partners | Staged product, certification, warranty and service exposure | Trust transfer map |
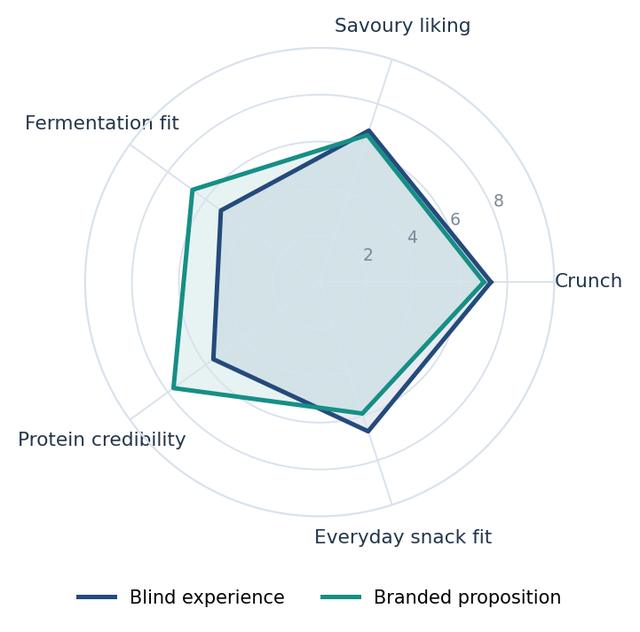
Fermented chickpea protein snack | Singapore | Category users, snack buyers and retail category managers | Blind experience followed by branded proposition exposure | Sensory-positioning gap |
Frequently combined with
- Customer Interviews
- Consumer Behaviour Analysis
- User Experience Research
- Purchase Decision Analysis
- Brand Feedback Research
08 | FAQ
Questions about Product Perception Studies
How is this different from an Industry Survey?
An Industry Survey asks a defined industry population what it needs, believes or intends. A Product Perception Study anchors the research to a specific product stimulus and traces how that product is interpreted.
Does the product need to be finished?
No. Research can use a proposition, concept, prototype, sample, demonstration, package, listing, technical proof or market-ready product. The conclusion remains limited to the stimulus tested.
Can one study include B2B and B2C audiences?
Yes, when both viewpoints matter to the same decision. B2B and B2C are not treated as the starting point. The participant architecture follows the product relationship and decision role.
Does the study predict sales?
Not by itself. It explains how the product is interpreted and how that perception affects stated or observed next action. Demand forecasting, pricing and purchase modelling require their own evidence.
Can existing customers be included?
Yes. Client-approved contacts can be combined with independent recruitment, panels, professional communities or market partners. Relationship and consent boundaries are agreed before outreach.
Does perception research validate technical performance or compliance?
No. It evaluates what participants understand and believe from the tested product and evidence. It does not replace engineering, safety, clinical, regulatory or legal validation.
Contact Us
Discuss your product perception question
Tell us the product, stimulus stage, audiences, markets and decision you need to make. August Research will design the participant access, exposure conditions, Cue-to-Meaning Perception Framework and decision outputs around the perception that matters.