MARKET & BUSINESS INTELLIGENCE | SECONDARY RESEARCH
Competitive Business
Benchmarking
Compare how corporate competitors perform today and where they are building future advantage.
Connect current position with strategic movement
Corporate competitors leave different evidence trails across financial reporting, hiring, investment, partnerships, acquisitions, facilities and market activity. August Research brings these signals into one controlled comparison so the client can see both present performance and the direction in which each competitor is moving.
Establish the position: Compare corporate peers through consistent definitions, boundaries and periods.
Read the movement: Interpret where hiring, capital, deals, partnerships and footprint changes indicate a developing capability.
Decide the response: Show which advantages should be defended, closed, leapfrogged or deliberately deprioritised.
What this service supports
- Financial, commercial and market position comparisons
- Competitive hiring trends and capability building priorities
- Investment, capital allocation and corporate expansion activity
- Partnership, joint venture, acquisition and portfolio movement
- Manufacturing plants, operating sites and capacity additions
- Conference participation, speaking visibility and ecosystem presence
- Board and strategy discussions requiring an independent corporate reference point
CORE PROMISE The output shows how corporate competitors differ, what their recent actions suggest and what the client can realistically do about it.
COMPARATOR DESIGN
The comparison set is part of the methodology
A list based only on market share or brand recognition can hide the companies most relevant to the decision. August Research builds the comparator set around commercial similarity and learning value.
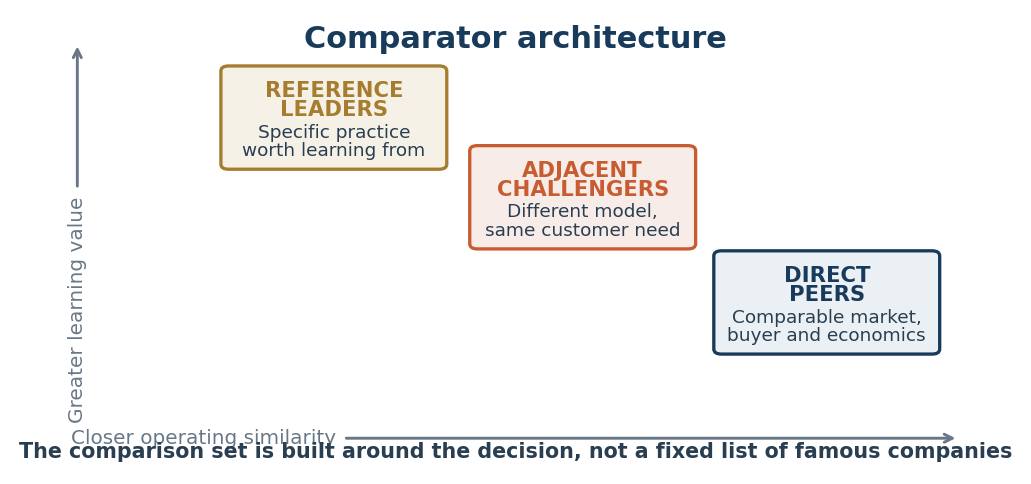
Adjacent challengers: Companies meeting the same customer need through a different proposition, channel or revenue model.
Reference leaders: Organisations worth studying for one specific capability, even when they operate outside the immediate category.
Comparator controls
Business boundary: Business unit and value chain role.
Market boundary: Geography, customer group and channel coverage.
Peer structure: Company scale, ownership model and reporting period.
Offer boundary: Product, service and revenue included in the comparison.
Evidence threshold: Minimum availability and confidence required for comparison.
WHY INDEPENDENT RESEARCH An external team can apply the same evidence rules to the client and its competitors, challenge internally favoured narratives and include unfamiliar challengers that established teams may overlook.
CORE METHODOLOGY
The Decision-Weighted Benchmark System
The methodology begins with the corporate decision and ends with a response choice. Current performance and forward looking signals are assessed together only after the comparison rules, evidence boundaries and normalization logic are visible.
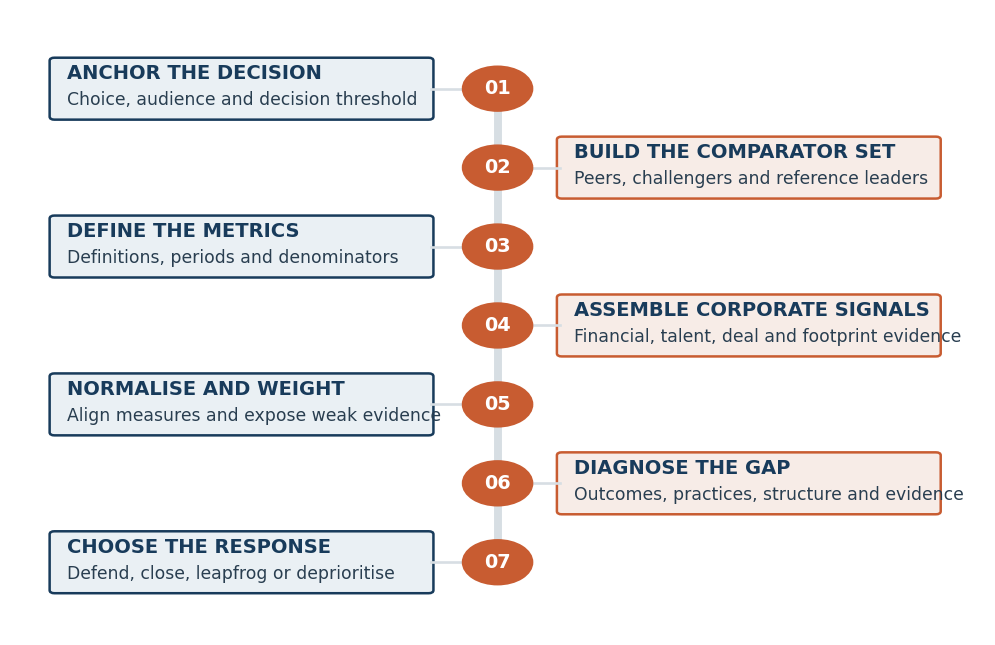
Controls applied throughout the study
- Every metric and corporate event has a definition, observation period and permitted evidence type.
- Reported facts, derived measures and analyst interpretations remain visibly separate.
- A single announcement is distinguished from a repeated pattern of hiring, investment or expansion.
- Missing evidence is shown as an evidence gap rather than converted into a low score.
- Weighting follows the client decision, and the response is filtered for value, feasibility, cost and timing.
RESEARCH PRINCIPLE A corporate signal becomes meaningful when it is connected with other evidence. Hiring, partnerships, acquisitions, facilities and conference activity are interpreted together rather than treated as isolated events.
MEASUREMENT ARCHITECTURE
Benchmark lenses follow the business question
Competitive Business Benchmarking compares corporate performance, strategic activity and capability build. Only dimensions that can change the client decision enter the final benchmark.
BENCHMARK LENS | WHAT IS COMPARED | POTENTIAL EVIDENCE |
|---|---|---|
Financial performance | Growth, profitability, revenue mix, capital intensity and cash generation | Financial statements, filings, investor materials and licensed financial data |
Commercial model | Pricing, contracts, recurring revenue, customer economics and risk sharing | Terms, tenders, pricing evidence, catalogues and commercial disclosures |
Portfolio and market reach | Offer breadth, customer groups, geographic coverage and route to market | Product records, channel listings, locations and customer evidence |
Hiring and capability build | Recruitment volume, functions, skills, seniority and hiring locations | Career sites, job records, workforce profiles and organisational disclosures |
Investment direction | Capital commitments, funding, capacity programmes and stated priorities | Filings, investor communications, funding records and announcements |
Partnerships and M&A | Alliances, joint ventures, acquisitions, divestments and ecosystem roles | Transaction data, ownership records, partner directories and company releases |
Manufacturing footprint | Plant openings, expansions, relocations, capacity and supply configuration | Facility records, permits, trade evidence, site announcements and hiring |
Market influence | Conference presence, speaking topics, sponsorships and association roles | Event agendas, exhibitor lists, presentations and membership records |
Corporate momentum | Frequency, direction and consistency of strategic activity over time | Dated signal register combining financial, talent, deal and footprint evidence |
SCOPE CONTROL A corporate growth decision may emphasize investment, acquisitions and new capacity. A commercial response may emphasize pricing, channels, customer reach and capability hiring. The lens set changes with the decision.
NORMALIZATION AND SCORING
Make unlike corporate signals comparable
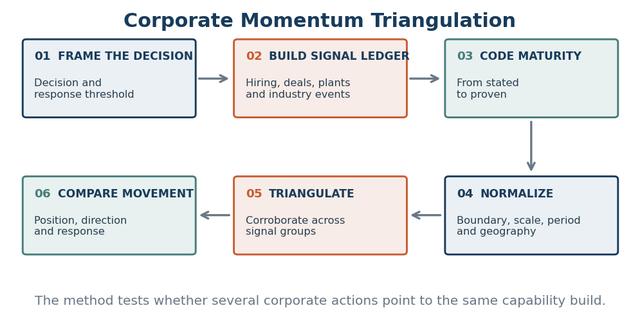
Benchmarking fails when financial results, hiring activity, investments and corporate events are compared without correcting for context. The normalization ledger records each adjustment and shows what remains genuinely comparable.
Period: Align fiscal years, reporting windows and the dates of corporate events.
Company boundary: Separate group activity from the business unit, subsidiary, geography or portfolio being benchmarked.
Scale and denominator: Express activity in comparable terms such as hires per 1,000 employees, investment per unit of revenue or plants serving a region.
Geography and business mix: Test whether a difference reflects strategy or simply a different market footprint, customer mix or ownership structure.
Signal maturity: Separate stated intentions, committed investments, projects under construction and operating capabilities.
Evidence strength: Record whether a position is reported, derived, proxy-based, corroborated or currently unavailable.
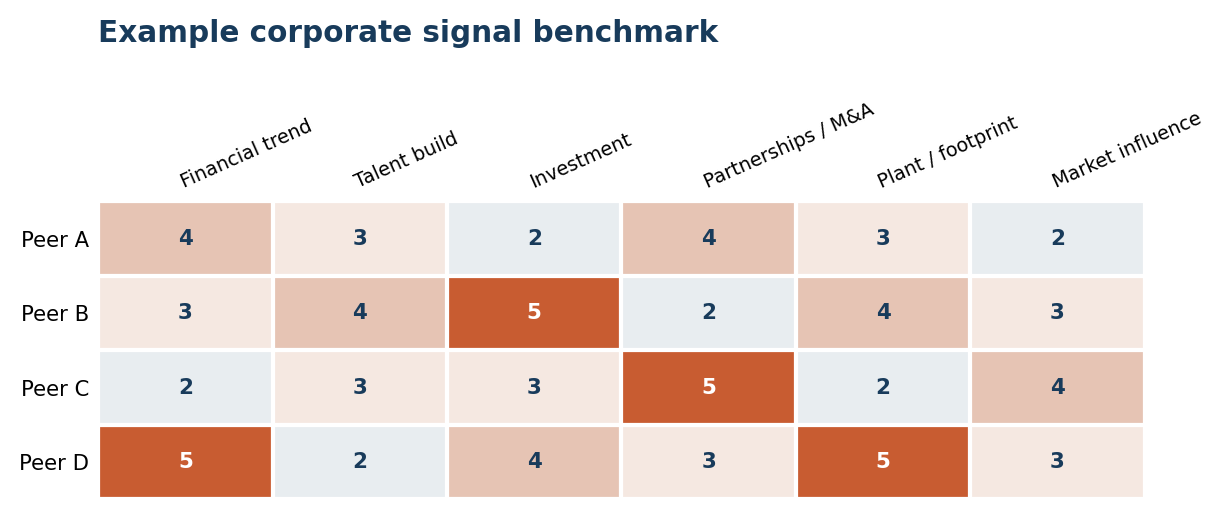
Four different meanings of a gap
Performance gap: A competitor currently achieves a stronger observable result.
Capability build gap: Hiring, investment or partnerships indicate that a competitor is strengthening a relevant capability.
Strategic movement gap: Acquisitions, plant activity or ecosystem moves indicate a different direction or pace of change.
Evidence gap: Public information is insufficient for a defensible comparison.
SCORING RULE No composite ranking is created unless the weights reflect the client decision and the evidence is strong enough to support aggregation.
EVIDENCE AND DELIVERY
Bring corporate signals into one benchmark
The evidence plan follows the selected corporate lenses and metric dictionary. Relevant licensed datasets are combined with company, workforce, transaction, facility, event and commercial evidence when they improve comparability.
EVIDENCE GROUP | POTENTIAL COVERAGE | BENCHMARK USE |
|---|---|---|
Company and financial | Annual reports, filings and registries; S&P Capital IQ, FactSet, Bloomberg or LSEG Workspace where relevant | Business boundaries, revenue mix, profitability, capital allocation and investment |
Workforce and capability | Career sites, job postings, professional profiles, organisational disclosures and talent datasets where relevant | Hiring direction, skills sought, functional growth and capability locations |
Transactions and capital | PitchBook, transaction records, ownership filings, funding rounds and investment announcements | Acquisitions, divestments, financing, portfolio change and expansion priorities |
Partnership ecosystem | Alliance announcements, joint ventures, partner directories, procurement awards and consortium records | Ecosystem position, market access, capability sourcing and risk sharing |
Facilities and capacity | Plant records, planning documents, permits, trade evidence, site announcements and location hiring | Manufacturing expansion, capacity, regional supply and operating readiness |
Market presence | Conference agendas, exhibitor and sponsor lists, speaking records, presentations and association memberships | Themes promoted, audience access, visibility and influence within the industry |
Commercial and customer | Price lists, tenders, catalogues, channel records, digital traffic and customer evidence | Offer, pricing, route to market, reach and customer proof |
What the client receives
- Comparator register with inclusion logic and relevance by decision
- Normalized corporate scorecard and evidence confidence ledger
- Strategic signal tracker covering hiring, investment, deals, partnerships, facilities and events
- Capability build and corporate movement timeline
- Corporate profiles connecting current position with strategic direction
- Gap mechanism map showing the reason behind important differences
- Defend, close, leapfrog and deprioritise action priorities
- Update tracker for metrics that require periodic refresh
DELIVERY FORMAT Outputs are provided as an editable evidence workbook, corporate signal dashboard, decision ready presentation, website adaptable charts and a concise executive briefing.
WHY AUGUST RESEARCH
A corporate comparison built around the decision
August Research does not apply one universal corporate scorecard. Each engagement receives its own comparator logic, company boundaries, signal definitions, normalization rules and action thresholds.
Decision first design: The benchmark is built around a commercial or operating choice, preventing the study from becoming an inventory of competitor facts.
Company boundary control: Group, business unit, subsidiary and geographic evidence is separated before corporate peers are compared.
Signal triangulation: Financials, hiring, investments, deals, partnerships, facilities and market activity are read together to test what a competitor is building.
Visible confidence: Observed facts, derived measures, proxies and missing information remain distinguishable throughout the output.
Action translation: Every priority is tested for business value, feasibility, investment requirement and time to respond.
Engagement formats
FORMAT | BEST USED WHEN | OUTPUT EMPHASIS |
|---|---|---|
Corporate position benchmark | The client needs a controlled comparison of current corporate performance | Normalized metrics, peer profiles and gap mechanisms |
Strategic movement benchmark | The client needs to understand where competitors are investing and building | Signal tracker, capability timeline and direction of movement |
Refreshable corporate benchmark | Competitor moves and priority measures require periodic updating | Update ledger, movement dashboard and trigger-based refresh |
AUGUST RESEARCH VALUE The client receives a benchmark that connects current corporate performance with the strategic actions shaping future competition, together with the reasoning required to decide which moves deserve a response.
APPLICATIONS
Illustrations
Each illustration begins with a current corporate decision and uses a different comparator architecture, signal set and interpretation logic.
INDUSTRY | INDUSTRY QUESTION | BENCHMARK LOGIC |
|---|---|---|
Specialty chemicals | How are specialty additives manufacturers building positions in lower carbon materials through acquisitions, application hiring, production investments, partnerships and industry conference visibility? | Strategic capability build benchmark |
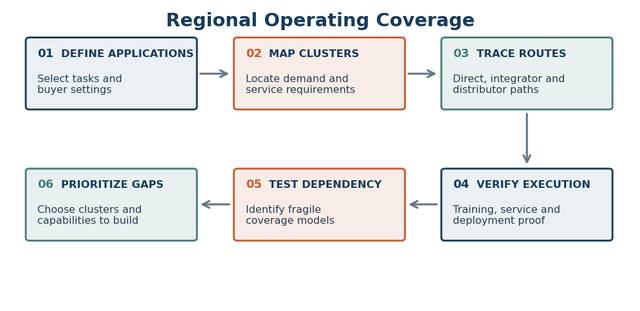
Industrial automation | How do collaborative robotics companies operating in North America compare on commercial growth, service hiring, system integrator partnerships, acquisitions and local operating footprint? | Regional operating build benchmark |
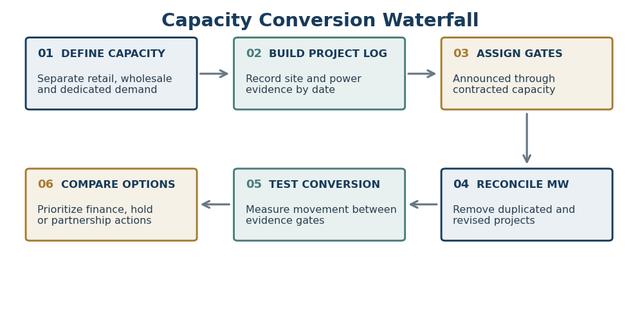
Data centre infrastructure | How do Nordic colocation operators compare on financial momentum, site expansion, power commitments, talent build, partnerships and contracted capacity signals? | Capital to capacity benchmark |
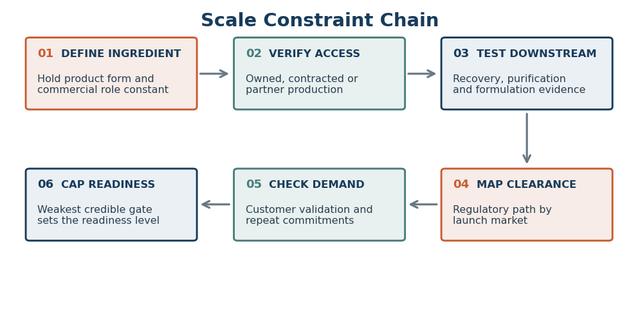
Food ingredients | How are precision fermentation ingredient companies progressing from investment to industrial scale through plants, outsourced production, commercial partnerships, hiring and customer access? | Scale readiness benchmark |
Cold chain logistics | How do temperature controlled logistics companies in India compare on warehousing investment, acquisitions, healthcare partnerships, network hiring and geographic expansion? | Network expansion benchmark |
From comparison to decision
- A short decision background explaining why the comparison is needed
- The corporate comparator logic, company boundary and observation period
- A signal set designed around only the activities relevant to the decision
- Relevant visuals such as heatmaps, company timelines, hiring patterns, deal maps and footprint comparisons
- Findings that connect current performance, strategic movement and the recommended response
EVIDENCE STANDARD Numbers, scores and positions are used only when the available evidence and normalization logic can support them.
PRACTICAL QUESTIONS
FAQ
How is this different from Competitive Technology Benchmarking?
Competitive Business Benchmarking compares corporate performance and strategic activity across financials, hiring, investment, partnerships, acquisitions, facilities, market presence and commercial position. Technical specifications, patents, engineering capability and technology maturity belong to the R&D-focused service.
Can the client be included in the benchmark?
Yes. Client data can be incorporated when supplied, but it is normalized to the same definitions and periods used for external companies.
Can private companies be benchmarked?
Yes, although the metric set may need to rely more heavily on operating evidence, channels, hiring, tenders, pricing, partnerships and other observable signals.
Does a missing data point mean that a competitor performs poorly?
No. Missing evidence remains an evidence gap. It is not silently converted into a low score.
Does one corporate signal prove a competitor's intent?
No. A job posting, partnership or plant announcement is interpreted as one item of evidence. Strategic direction is concluded only when the signal is corroborated by other actions or disclosures.
Can the benchmark be refreshed?
Yes. The metric dictionary and evidence ledger are structured so selected measures can be updated without rebuilding the study from the beginning.
Contact Us
START WITH THE DECISION Tell us which corporate competitors are being compared, what decision the benchmark must support and which strategic movements matter most. August Research will design the comparator set, signal architecture, measurement system and evidence plan around that requirement.