COMPANY PROFILING | CONSTRUCTION EQUIPMENT
Does This East African Equipment Leasing Operator
Have the Regional Footprint It Claims?
A location-and-asset profile for an equipment manufacturer planning account coverage and parts inventory.
11 claimed
LOCATIONS
3 countries
GEOGRAPHY
2020 to 2026
EVIDENCE WINDOW
5 weeks
DECISION HORIZON
The business situation
A construction-equipment manufacturer was reassessing how it served a large private leasing operator active across East Africa. The operator described eleven regional locations and a fleet of more than 450 machines. The manufacturer needed to determine where operating demand, service capability and parts consumption were actually concentrated before assigning account resources.
DECISION QUESTION Which locations represent evidenced operating hubs, which are commercial offices or registrations, and where should the manufacturer place service and parts support?
Why a location list was misleading
Registration is not operation: A legal entity or office address does not establish fleet, workshop or contract activity.
Fleet claims are fluid: Owned, financed, hired-in and disposed assets can be mixed in one marketing number.
Demand is uneven: Country presence matters less than the actual concentration of machines, technicians and active projects.
RESEARCH DESIGN
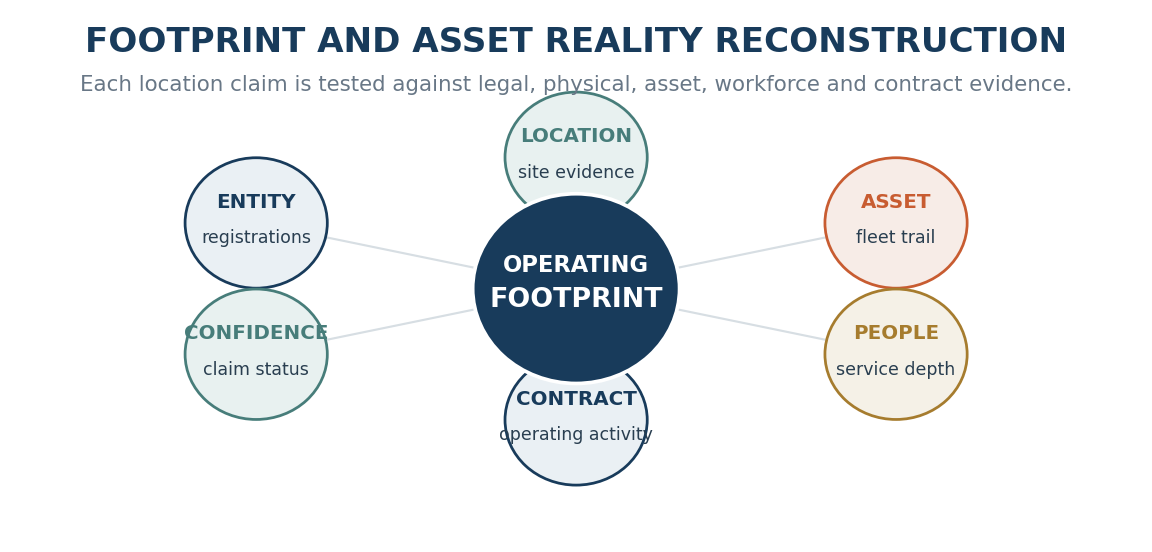
The profile tested every location as an operating claim
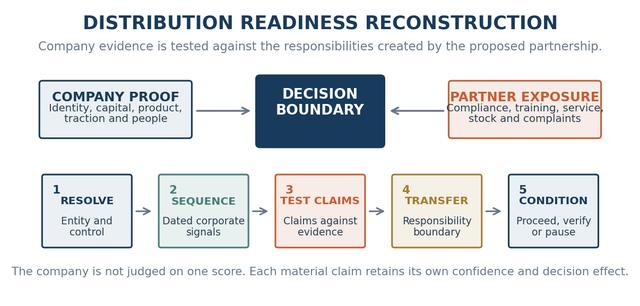
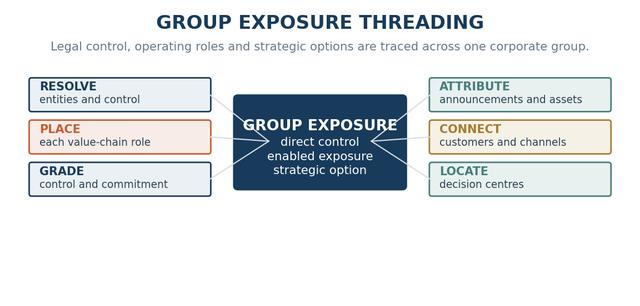
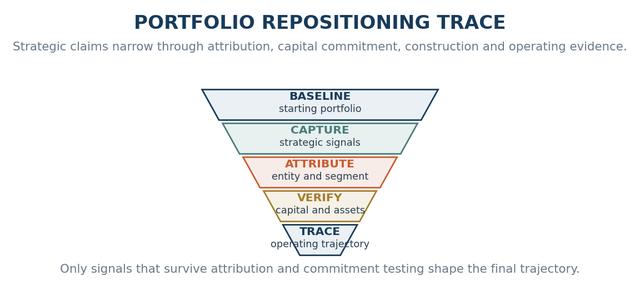
Footprint and Asset Reality Reconstruction began with the company and branch register. Each claimed site then required supporting evidence across physical premises, fleet activity, people, service capability and current contracts before it was classified as operating.
Profile boundary
BOUNDARY | INCLUDED |
|---|---|
Entities | Kenyan operating company and related registrations in Uganda and Tanzania |
Operations | Depots, commercial offices, workshops, fleet, technicians, parts storage and active project evidence |
Geography | Kenya, Uganda and Tanzania, with city-level classification where evidence allowed |
Time | Operating signals from January 2020 through August 2026 |
Evidence architecture
EVIDENCE FIELD | WHAT WAS TESTED | CONTROL |
|---|---|---|
Corporate records | Entities, branches, directors and status | Dormant and active registrations separated |
Site evidence | Addresses, workshops, yard activity, maps and local permits | Office, depot and workshop coded differently |
Fleet trail | Tender schedules, project records, imports, asset sales and machine sightings | Duplicates and hired-in assets removed |
People and contracts | Technicians, vacancies, service roles and active projects | Current activity weighted above historic claims |
RECONSTRUCTED FOOTPRINT
The platform was real, but smaller and more concentrated
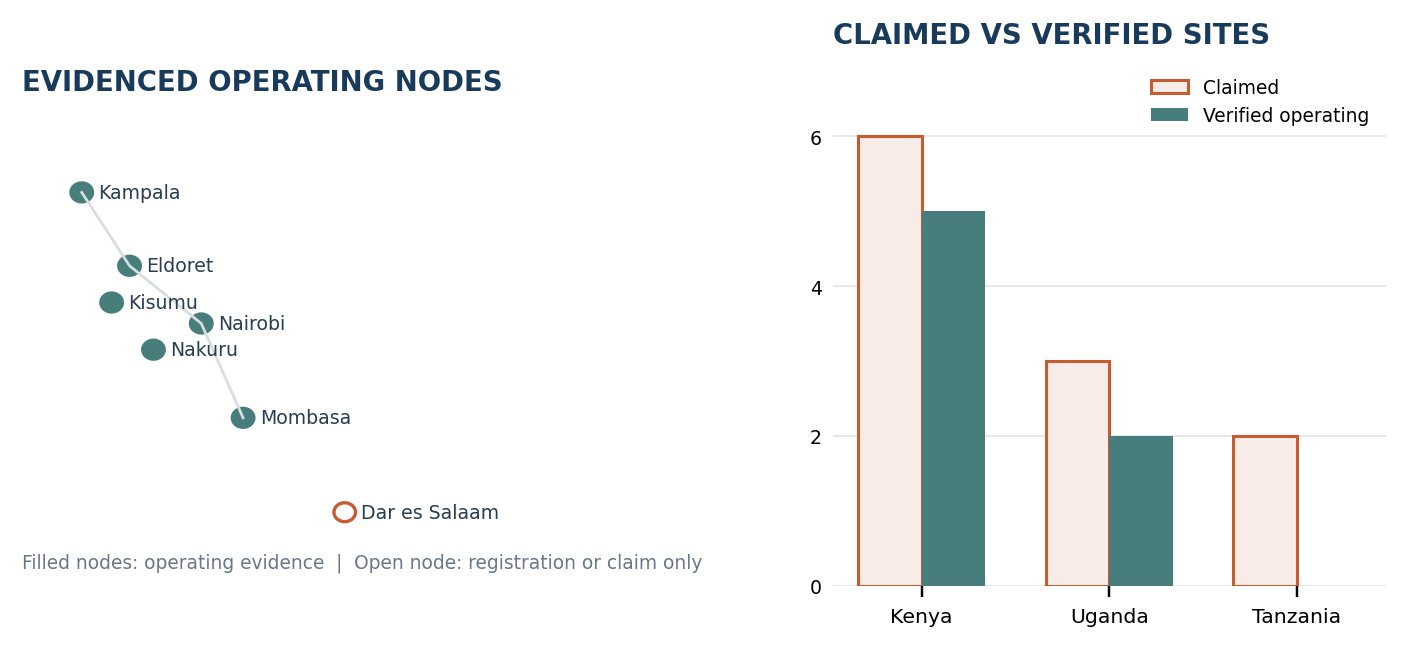
Seven operating sites were supported by multiple evidence types. Two further locations appeared to be commercial offices, while two claims had registration or promotional evidence without current operating proof. Kenya remained the centre of fleet and service activity.
PROFILE FIELD | RECONSTRUCTED FINDING | DECISION EFFECT |
|---|---|---|
Site footprint | Seven operating sites, two commercial offices and two locations without current operating evidence | Support should follow verified hubs |
Observed fleet | A deduplicated evidence universe of 286 machines, compared with a public claim of more than 450 | Parts demand should not use the headline fleet |
Service capacity | Five workshops, thirty-eight observed technicians and parts stock at three hubs | Nairobi and Mombasa carried the strongest service case |
Regional depth | Uganda showed active fleet and service evidence; Tanzania showed registration and sales activity but limited operating proof | Country coverage required different service models |
INTERPRETATION The operator was a credible regional account, but its public footprint ran ahead of the evidence needed for equal service investment across all three countries.
DECISION OUTCOME
Concentrate support around evidenced demand
The profile supported a hub-based account model. Parts inventory and technical coverage would be anchored in Nairobi and Mombasa, with planned support for Kampala. Tanzania would remain distributor-led until fleet, workshop and project evidence strengthened.
LOCATION RESPONSE | RECOMMENDED ACTION | EVIDENCE TRIGGER |
|---|---|---|
Kenya hubs | Dedicated account coverage and critical-parts planning | Concentrated fleet, workshops and project activity |
Uganda | Scheduled technical coverage and defined replenishment route | Verified fleet and two operating locations |
Tanzania | Distributor-led support with quarterly evidence review | Upgrade only when workshop and active fleet proof emerges |
What the client would receive
- Resolved entity and branch register
- City-level operating-footprint classification
- Deduplicated fleet evidence register
- Workshop, technician and parts-capacity map
- Account coverage and inventory allocation brief
Indicative delivery
A three-country footprint profile would typically require four to six weeks. Timing depends on registry access, the visibility of private assets and the volume of tender, contract and location evidence requiring reconciliation.
STUDY BOUNDARY This profile supports commercial resource allocation from available evidence. It does not verify legal title to individual assets or replace financial, insurance or legal checks.
NOTE The company, figures, evidence and conclusions in this example are hypothetical and are not presented as real client outcomes.
Contact Us
SEE WHERE THE COMPANY ACTUALLY OPERATES Tell us which private operator, claimed footprint and commercial decision you need to test. August Research will resolve the entities, locations, assets and activity into an evidence-led operating profile.