COMPETITIVE BUSINESS BENCHMARKING | SPECIALTY CHEMICALS
Corporate Momentum in
Lower Carbon Coatings Additives
How a coatings additives producer could compare six corporate peers and decide where to defend, close or leapfrog.
6
CORPORATE PEERS
Europe
GEOGRAPHIC SCOPE
36 months
SIGNAL WINDOW
7
SIGNAL GROUPS
The business situation
A European coatings additives producer needed to understand whether competitors were merely communicating lower carbon ambitions or building the corporate capabilities required to commercialize them. Conventional comparisons of product portfolios and revenue were not enough. The client needed to see where peers were hiring, investing, partnering, acquiring, adding production capacity and establishing industry visibility.
DECISION QUESTION Which corporate capabilities should the client strengthen during the next 24 months to protect its position in lower carbon coatings additives?
Why the comparison was difficult
Uneven disclosure: Large groups report at different segment and geographic levels.
Mixed signal maturity: A stated target, signed partnership and operating plant do not represent the same level of commitment.
Attribution risk: Group activity may not belong to the coatings additives business being compared.
Timing: Hiring and partnership activity may indicate movement before it appears in financial results.
STUDY DESIGN
A comparator set designed around corporate relevance
The study did not select companies solely by market share. Each peer needed a relevant European coatings additives position or a corporate model that could reveal how lower carbon capabilities are being built and commercialized.
COMPARATOR GROUP | COUNT | ROLE IN THE BENCHMARK |
|---|---|---|
Direct peers | 3 | Diversified specialty additives manufacturers serving comparable coatings customers in Europe |
Adjacent challengers | 2 | Focused materials companies using partnerships or specialized production to enter the same customer need |
Reference leader | 1 | A company outside the closest peer group with a strong corporate model for scaling lower carbon materials |
Scope parameters
Offer boundary: Coatings additives positioned around lower carbon inputs, reduced formulation impact, process efficiency or longer service life.
Geography: Corporate, commercial and operating activity connected with European coatings markets.
Evidence window: Thirty six months of strategic movement, supported by an installed baseline where required.
Entity boundary: The relevant business unit or regional activity; group level evidence only when it could be allocated defensibly.
Corporate signals captured
SIGNAL GROUP | WHAT ENTERED THE EVIDENCE LEDGER |
|---|---|
Financial and portfolio | Revenue direction, portfolio emphasis, stated priorities and capital allocation |
Hiring and organization | Roles, skills, seniority, functions and hiring locations |
Investment and facilities | Capital commitments, plant openings, expansions and operating readiness |
Partnerships and M&A | Alliances, joint ventures, acquisitions, divestments and ecosystem access |
Market influence | Conference presence, speaking themes, sponsorships and association participation |
SELECTION CONTROL A company was not rewarded for disclosing more information. Evidence volume and evidence strength were assessed separately.
METHODOLOGY
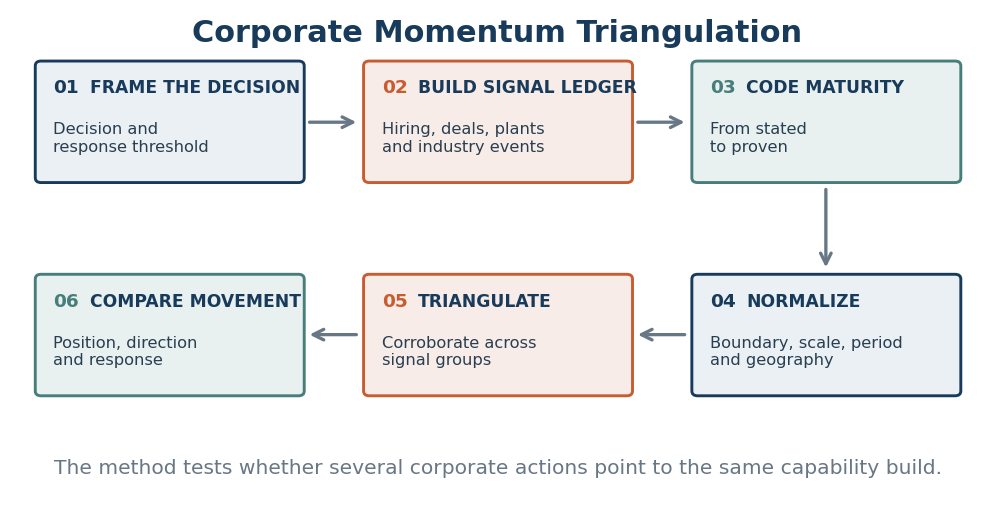
Corporate Momentum Triangulation
This illustration uses a method designed for corporate movement. It tests whether several independent actions point toward the same capability build and whether that movement has progressed beyond communication.
How signal maturity was coded
MATURITY | EVIDENCE THRESHOLD |
|---|---|
Stated | Priority, target or ambition has been communicated |
Funded | Capital, budget, financing or formal investment commitment is visible |
Building | Hiring, construction, partnership execution or integration is underway |
Operating | The capability, facility or commercial model is active |
Proven | Customer adoption, repeat activity or operating evidence supports the claim |
Normalization rules
- Hiring activity was considered relative to company size and the relevant business footprint.
- Investments were separated by announced, committed, under construction and operational status.
- Acquisitions and partnerships were tagged by the capability or market access they added.
- Conference activity was weighted by relevance, role and repeated participation, not attendance alone.
- Missing evidence remained unscored rather than being interpreted as weak performance.
INFERENCE RULE Strategic direction was concluded only when at least two independent signal groups supported the same interpretation.
ANALYTICAL EXHIBITS
Separate visibility from genuine corporate movement
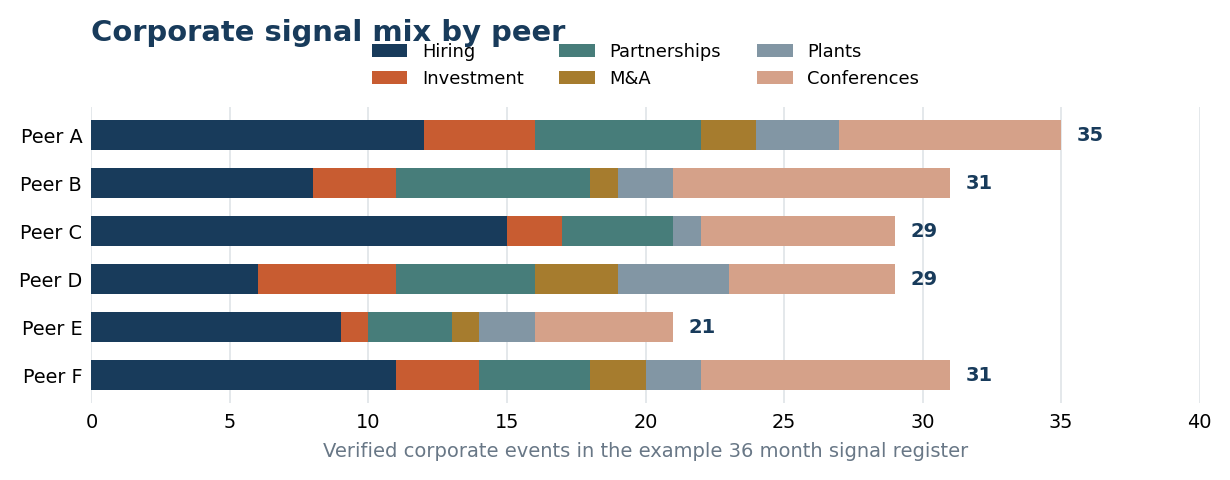
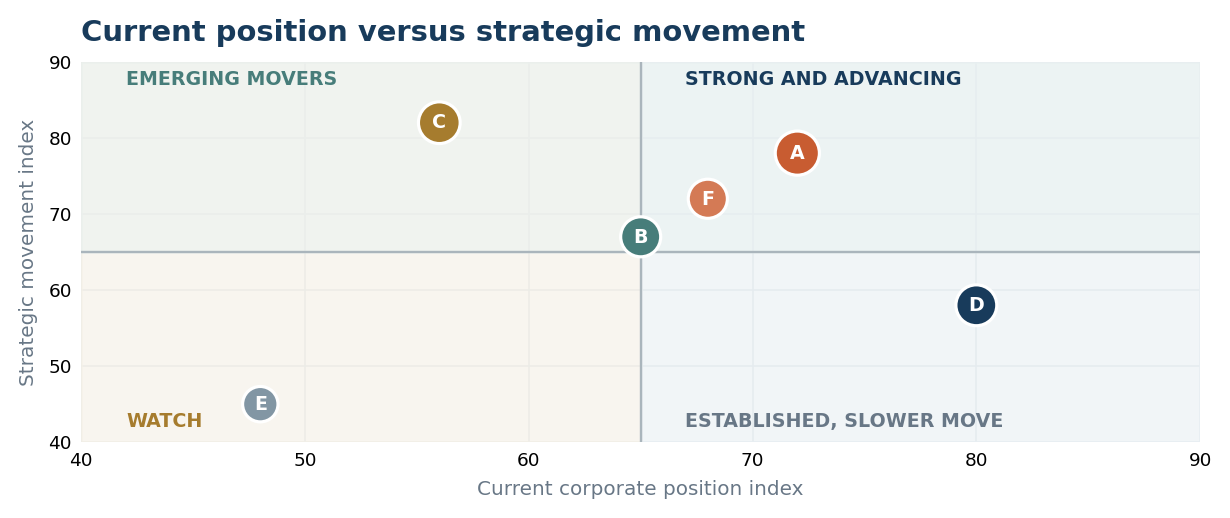
The first exhibit shows the mix of verified corporate events. The second distinguishes the strength of the current position from the pace and credibility of strategic movement.
How the output would be interpreted
Peer C: High hiring activity may indicate rapid capability build, but the conclusion would require investment or commercial corroboration.
Peer D: A strong current position with slower movement may remain defensible, but could become vulnerable if emerging movers reach operating scale.
Peer A: A balanced signal mix across hiring, partnerships, plants and market activity suggests broader corporate commitment.
Example values demonstrate the output structure and are not findings about named companies.
DECISION OUTPUT
Translate corporate movement into response choices
The benchmark does not end with a ranking. It identifies which competitor moves are credible, what capability they may create and how the client should respond within its own strategic and investment constraints.
RESPONSE | DECISION LOGIC |
|---|---|
Defend | Protect positions where the client already has customer access, application support or operating evidence that competitors cannot quickly reproduce. |
Close | Address a material gap when several peers are building the same capability and the client can respond within the required period. |
Leapfrog | Pursue a different partnership, regional position or commercialization model when copying the peer approach would arrive too late. |
Watch | Track early signals that are not yet mature enough to justify immediate investment. |
What the client receives
- Corporate comparator register and inclusion logic
- Dated signal ledger with evidence maturity and confidence coding
- Hiring, investment, partnership, acquisition and facility movement timelines
- Current position and strategic movement dashboard
- Corporate peer profiles and response priorities
- Refresh tracker for signals requiring continued monitoring
Delivery and boundaries
Indicative delivery: Six to eight weeks for the six peer, thirty six month scope shown here.
Timing note: The schedule changes with the number of peers, evidence availability, language coverage and depth of historical reconstruction.
Evidence boundary: No score is assigned where company attribution or signal maturity cannot be supported.
Contact Us
START WITH THE CORPORATE DECISION Tell us which competitors matter, which strategic movements you need to understand and what response the benchmark must support. August Research will design the comparator set, signal architecture and decision logic around that requirement.