COMPETITIVE BUSINESS BENCHMARKING | INDUSTRIAL AUTOMATION
Regional Operating Depth in
Collaborative Robotics
How a robotics company could compare seven peers and decide where North American growth requires direct capability, integrator enablement or distribution reach.
7
CORPORATE PEERS
8
INDUSTRIAL CLUSTERS
30 months
EVIDENCE WINDOW
3
ROUTE MODELS
The business situation
A collaborative robotics company planned its next stage of North American expansion. Product specifications alone could not show whether competitors were able to sell, integrate, commission and support applications across major manufacturing clusters. The decision required a corporate benchmark of operating reach, partner quality, field capability and local investment.
DECISION QUESTION Which clusters and operating capabilities should the company prioritize during the next eighteen months?
Why a conventional comparison would fail
Installed reach: A distributor listing does not prove local integration or service capability.
Mixed route models: Direct teams, system integrators and distributors carry different levels of execution control.
Application variation: Welding, machine tending, packaging and inspection require different partner skills.
Geographic concentration: National claims can conceal strong coverage in only a few manufacturing clusters.
COMPARATOR ARCHITECTURE
Build the peer set around route to market relevance
The comparator set would include established manufacturers, expansion challengers and one integrator led reference model. Each company must serve overlapping applications and show observable North American commercial activity.
COMPARATOR GROUP | COUNT | REASON FOR INCLUSION |
|---|---|---|
Established manufacturers | 3 | Broad portfolios with visible North American sales, service and training activity |
Expansion challengers | 3 | Growing regional presence through hiring, partnerships or new operating locations |
Reference model | 1 | A company demonstrating a distinctive integrator or application enablement model |
Evidence architecture
EVIDENCE LAYER | WHAT IS TESTED |
|---|---|
Commercial reach | Regional sales hiring, offices, demonstration centers and lead ownership |
Integrator depth | Certified partners, application specialisms, training and repeated deployment evidence |
Service execution | Field engineers, response coverage, spare parts and commissioning support |
Corporate movement | Acquisitions, partnerships, facilities, investment and leadership appointments |
Market presence | Trade show participation, application speaking themes and manufacturing association activity |
COVERAGE RULE Presence was credited only when a peer showed an active route to customer and an observable execution capability in the cluster.
METHODOLOGY
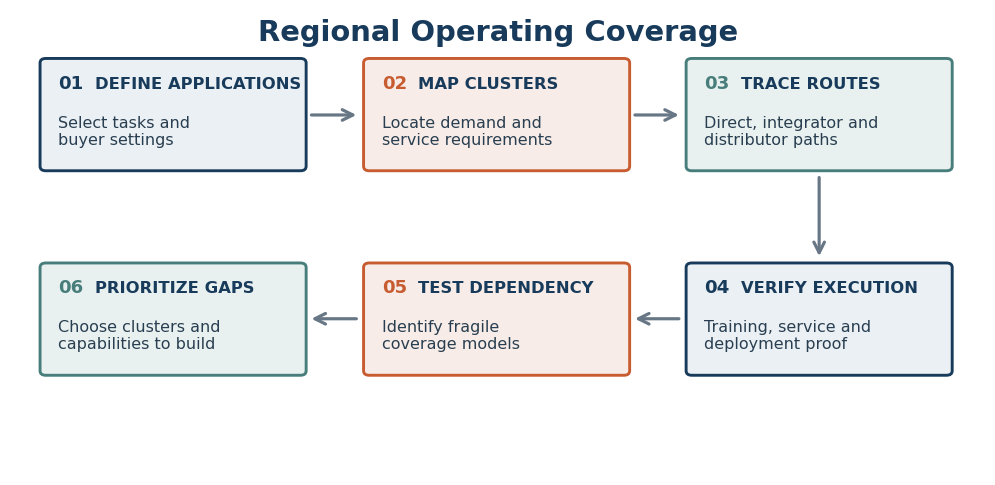
Regional Operating Coverage
This method reconstructs how each peer reaches, enables and supports customers in specific manufacturing clusters. It distinguishes broad channel visibility from operating depth.
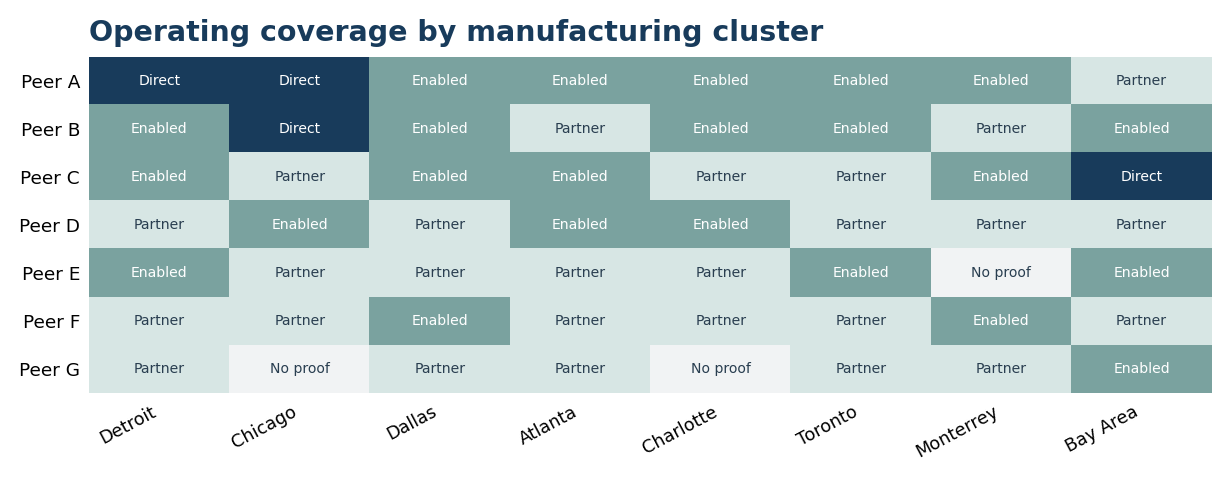
Cluster evidence levels
LEVEL | REQUIRED EVIDENCE |
|---|---|
No proof | No active route or operating evidence located |
Partner present | A distributor or integrator is active, but enablement depth is unclear |
Enabled coverage | Application training, certification or repeated deployment evidence is present |
Direct depth | Local commercial ownership and service execution are both visible |
Controls
- Partner counts were not treated as equal when application competence differed.
- Hiring was allocated by function and cluster rather than using national totals.
- Conference appearances counted only when they demonstrated application or buyer relevance.
- Acquisitions were credited only for the operating capability they added in North America.
ANALYTICAL EXHIBITS
See where reach becomes executable capacity
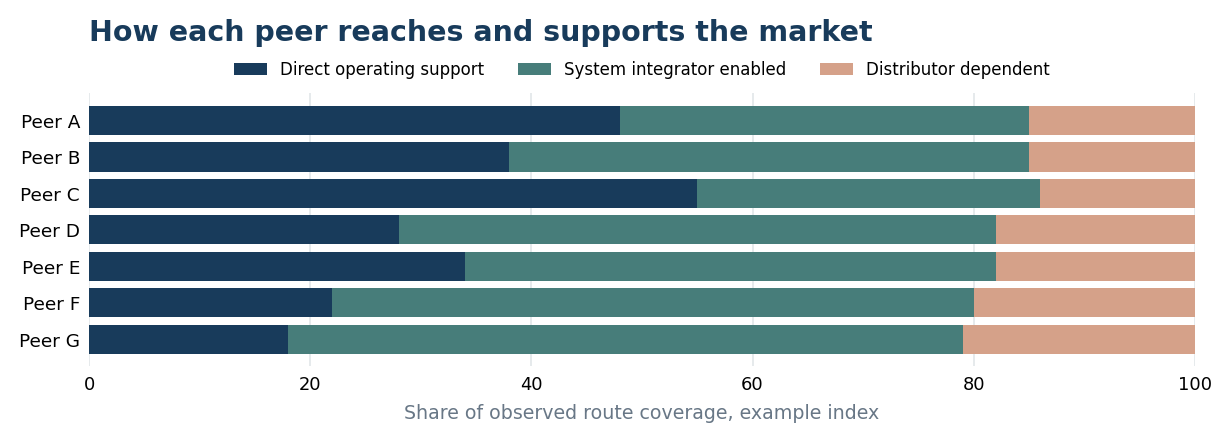
The cluster matrix shows the strongest verified route in each location. The route mix reveals whether coverage is controlled directly or depends on external partners.
How the output would guide action
Peer A: Broad direct depth may justify defending service responsiveness rather than adding more channel partners.
Peer D: Integrator strength can provide efficient reach, but application dependence should be tested cluster by cluster.
Peer G: A distributor heavy model may create whitespace for stronger commissioning and post installation support.
Values demonstrate the planned output and are not findings about named companies.
DECISION OUTPUT
Choose where to build, enable or partner
RESPONSE | DECISION LOGIC |
|---|---|
Build | Add direct commercial or service capability where cluster demand is strategic and partner execution is weak. |
Enable | Invest in training, application kits and lead sharing where capable integrators already exist. |
Partner | Use a specialist route where demand is attractive but does not justify fixed operating capacity. |
Hold | Avoid broad expansion where apparent peer presence is mostly channel visibility without deployment proof. |
What the client receives
- Seven company comparator register and inclusion logic
- Cluster level route and operating coverage matrix
- Integrator, distributor and direct capability profiles
- Hiring, partnership, acquisition and footprint timeline
- Cluster priorities with build, enable and partner actions
Delivery and boundaries
Indicative delivery: Six to seven weeks for seven peers and eight manufacturing clusters.
Timing note: Timing changes with partner validation, historical depth and the number of applications included.
Evidence boundary: A partner listing is not treated as operating coverage without current execution evidence.
Contact Us
START WITH THE CORPORATE DECISION Tell us which robotics applications, competitors and North American clusters matter. August Research will design the route model, operating evidence tests and response priorities around that decision.