COMPETITIVE BUSINESS BENCHMARKING | DATA CENTRE INFRASTRUCTURE
From Secured Power to
Sellable Nordic Capacity
How an infrastructure investor could compare five colocation operators on their ability to convert sites, power and capital into commissioned and contracted capacity.
5
OPERATORS
4
NORDIC COUNTRIES
42 months
PROJECT WINDOW
6
CAPACITY GATES
The business situation
An infrastructure investor was assessing whether a Nordic colocation platform had the operating discipline to scale. Announced megawatts created an impressive pipeline, but the investment decision depended on what portion had site control, credible power access, construction progress, commissioning evidence and customer commitment.
DECISION QUESTION Which operators show the strongest capacity conversion discipline, and where would capital face the least execution leakage?
Why a conventional comparison would fail
Pipeline inflation: Announced capacity may combine early options with funded projects.
Power ambiguity: Grid applications, reserved power and energized supply are not equivalent.
Project overlap: A revised site announcement can be counted twice unless the project history is reconciled.
Contract opacity: Customer interest, reserved capacity and executed contracts require separate treatment.
CAPACITY DEFINITION
Compare projects at the same evidence gate
The study would build a project level ledger for five operators across Sweden, Norway, Finland and Denmark. Self use hyperscale campuses would remain outside the benchmark unless they formed part of the operator's commercial colocation model.
CAPACITY GATE | EVIDENCE REQUIRED | DECISION MEANING |
|---|---|---|
Announced | Named project, location and stated capacity | Strategic intent |
Site control | Ownership, lease or documented development control | Location is accessible |
Power secured | Credible grid, utility or generation commitment | Energy path exists |
Construction | Physical build or disclosed capital deployment | Delivery has started |
Commissioned | Operating capacity available for service | Capacity can be sold |
Contracted | Customer commitment supported by disclosed evidence | Demand is attached |
Corporate signals around the project ledger
- Capital raises, ownership changes and project financing
- Power purchase agreements, utility relationships and energy partnerships
- Construction hiring, operating talent and leadership appointments
- Customer, cloud, connectivity and heat reuse partnerships
- Acquisitions and site portfolio consolidation
UNIT RULE Megawatts are compared only after capacity type, location, project identity and maturity date have been reconciled.
METHODOLOGY
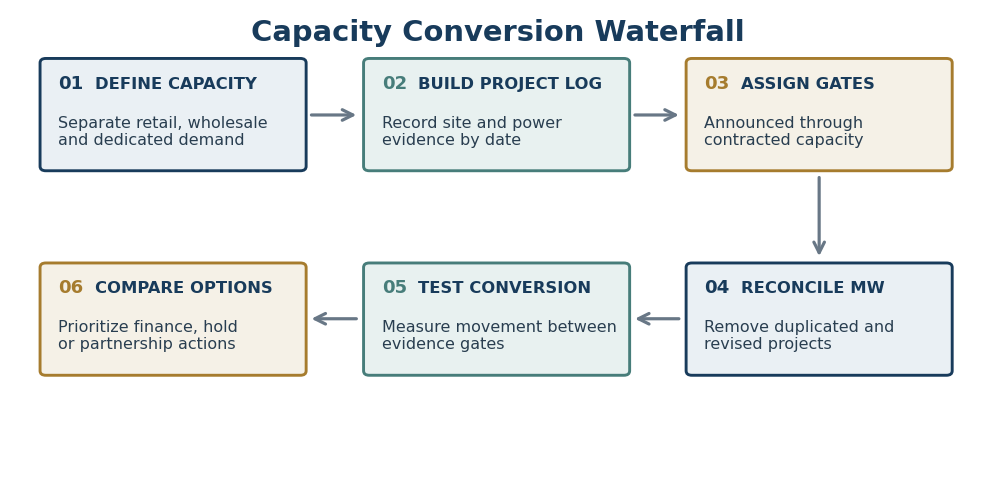
Capacity Conversion Waterfall
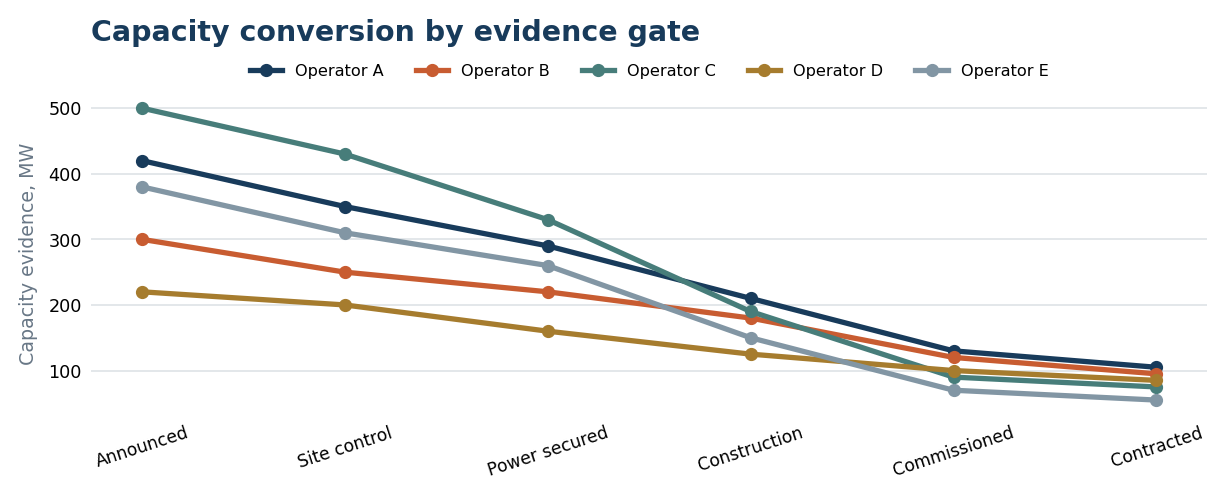
This method follows each project through six evidence gates. It evaluates both the size of the pipeline and the operator's demonstrated ability to move capacity toward service and customer commitment.
Conversion measures
MEASURE | CALCULATION PURPOSE |
|---|---|
Power conversion | Share of power secured capacity that reaches commissioning |
Build conversion | Share of construction capacity that becomes operational |
Demand attachment | Share of commissioned capacity supported by contracted evidence |
Time in gate | Elapsed period between successive project maturity events |
Delivery consistency | Variation between announced dates and observed commissioning |
Controls
- Capacity revisions are dated rather than overwritten.
- Powered land is not treated as commissioned data centre capacity.
- Cross country portfolios are allocated at project level.
- Undisclosed customer names do not invalidate contracts when credible capacity evidence exists.
ANALYTICAL EXHIBITS
Expose where capacity leaves the pipeline
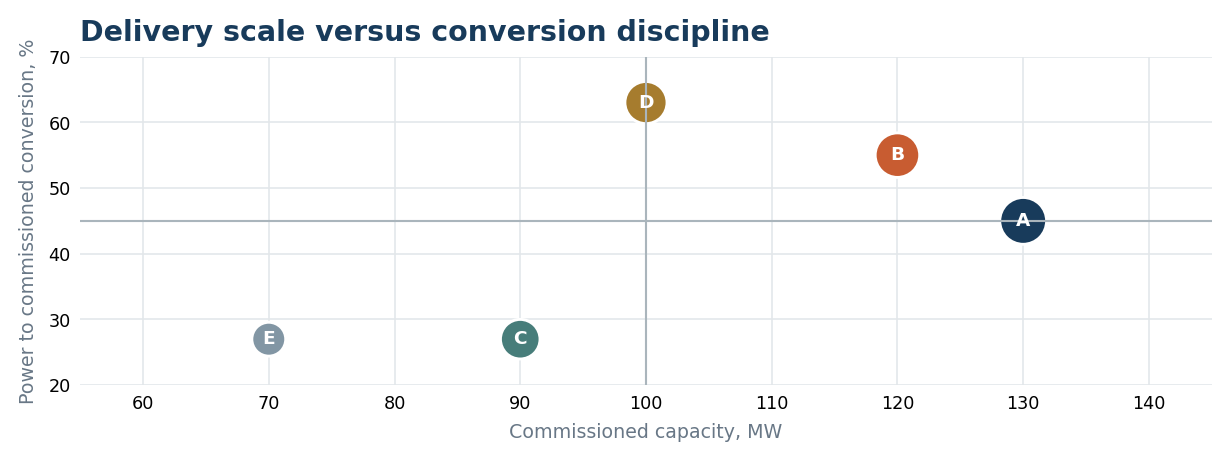
Conversion curves reveal the point at which each operator loses momentum. The delivery matrix then compares operational scale with the proportion of secured power converted into commissioned capacity.
Reading the pattern
Operator D: A smaller pipeline with stronger conversion may offer more dependable near term capacity than a larger early stage portfolio.
Operator C: Large announced and secured volumes require scrutiny when commissioning and contracts remain limited.
Operator A: High delivered scale with moderate conversion may support investment if remaining power and construction risks are understood.
The MW values show a realistic output structure and do not describe named operators.
DECISION OUTPUT
Allocate capital by conversion evidence
ACTION | WHEN IT IS SUPPORTED |
|---|---|
Finance | Project maturity and operator conversion history support the delivery case. |
Stage capital | Site and power evidence are credible, but construction or demand still requires proof. |
Partner | A strong location needs operating, power or customer capability from another party. |
Hold | Pipeline value relies primarily on announcements or unreconciled capacity. |
What the client receives
- Five operator and project comparator register
- Reconciled capacity ledger by country and maturity gate
- Project conversion curves and delivery timing analysis
- Power, capital, partnership and talent signal timeline
- Investment actions with evidence gaps and refresh triggers
Delivery and boundaries
Indicative delivery: Seven to nine weeks for five operators across four Nordic countries.
Timing note: Timing depends on project count, corporate structures and the depth of power and contract verification required.
Evidence boundary: Capacity remains unscored when project identity, MW type or maturity cannot be reconciled.
Contact Us
START WITH THE CORPORATE DECISION Tell us which operators, countries and capacity definitions matter to the investment decision. August Research will construct the project ledger and conversion tests around that scope.