COMPETITIVE BUSINESS BENCHMARKING | FOOD INGREDIENTS
Which Precision Fermentation
Companies Can Actually Scale?
How an ingredient company could compare eight peers across production access, downstream capability, regulatory progress and customer proof.
8
CORPORATE PEERS
4
LAUNCH MARKETS
48 months
EVIDENCE WINDOW
6
READINESS GATES
The business situation
A food ingredient company was evaluating partnership and investment options in precision fermentation. Funding announcements and pilot claims showed activity, but did not answer whether a company could produce the right ingredient repeatedly, complete downstream processing, enter priority markets and secure customers at a commercially relevant level.
DECISION QUESTION Which companies have a credible route to repeated commercial production, and which constraint is most likely to delay scale?
Why a conventional comparison would fail
Capacity access: Owned facilities, tolling agreements and development partnerships provide different levels of control.
Downstream burden: Fermentation output is not a finished ingredient until recovery and purification are resolved.
Regulatory sequence: Readiness changes by ingredient, intended use and launch geography.
Commercial proof: A memorandum, sample evaluation and recurring customer order are not equivalent.
COMPARATOR ARCHITECTURE
Compare companies with overlapping commercial obligations
The peer set would include ingredient developers, platform companies and production access references serving comparable food or nutrition applications. The United States, Canada, the European Union and the United Kingdom would be included only where the chosen ingredient had a plausible launch path.
COMPARATOR GROUP | COUNT | BENCHMARK ROLE |
|---|---|---|
Ingredient developers | 4 | Companies commercializing a defined protein, fat, enzyme or functional ingredient |
Platform companies | 2 | Businesses using a broader organism or strain platform across several ingredients |
Production references | 2 | Companies whose production access model provides a useful scaling comparison |
Readiness evidence
GATE | EVIDENCE CAPTURED |
|---|---|
Financial runway | Funding, strategic investment and disclosed capital allocation |
Fermentation access | Owned assets, reserved capacity, tolling and operating partnerships |
Downstream capability | Recovery, purification, drying, blending and quality systems |
Regulatory progress | Submissions, clearances and market specific launch conditions |
Customer proof | Trials, offtakes, joint development, launches and repeat commercial activity |
Repeat production | Successive runs, volume progression and supply continuity evidence |
COMPARISON RULE Readiness is constrained by the weakest essential gate. Strong funding cannot compensate for missing downstream, regulatory or customer evidence.
METHODOLOGY
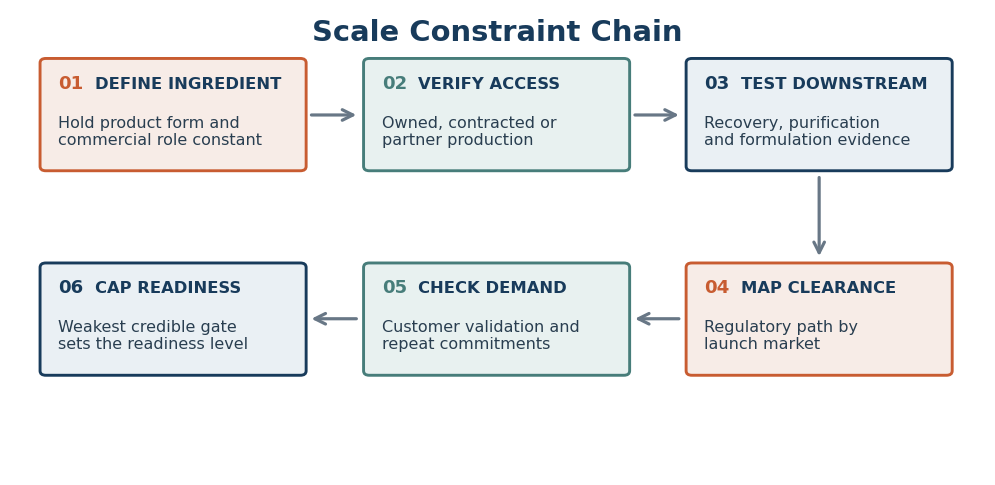
Scale Constraint Chain
This approach avoids a blended score that can conceal a decisive bottleneck. Each company is tested across six essential gates, and overall readiness is capped by the weakest gate supported by credible evidence.
Evidence strength scale
LEVEL | INTERPRETATION |
|---|---|
0 | No usable public evidence |
1 | Intent or early development activity |
2 | Credible access or progress, but material dependencies remain |
3 | Operating evidence supports near term commercial readiness |
4 | Repeated evidence demonstrates dependable execution |
Controls
- Funding was dated and linked to the stated use of proceeds.
- Facility nameplate capacity was separated from accessible ingredient capacity.
- Regulatory progress was assessed by ingredient and intended market.
- Commercial partnerships were coded by development, launch and repeat supply maturity.
ANALYTICAL EXHIBITS
Find the constraint that sets the commercial pace
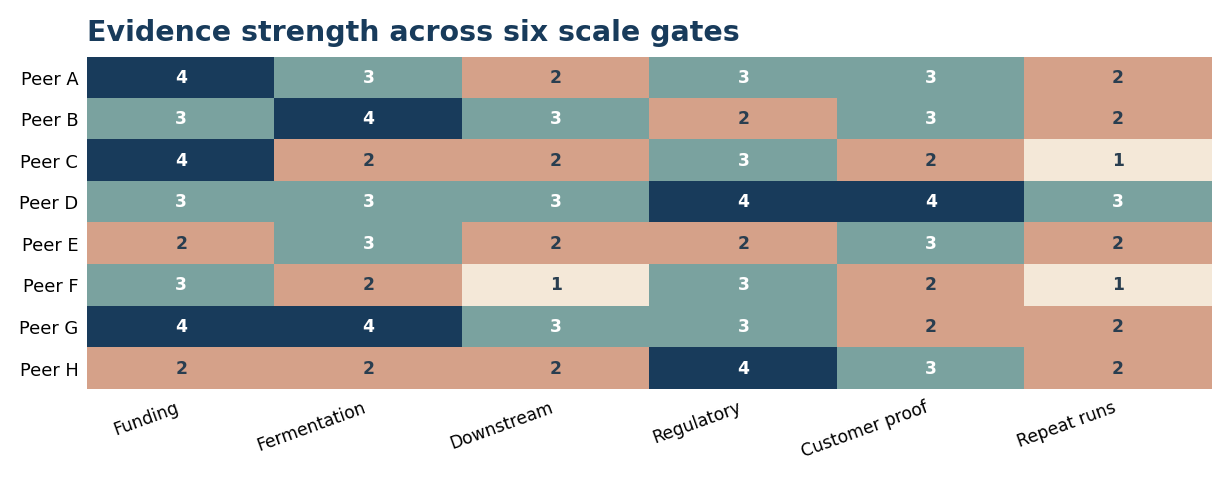
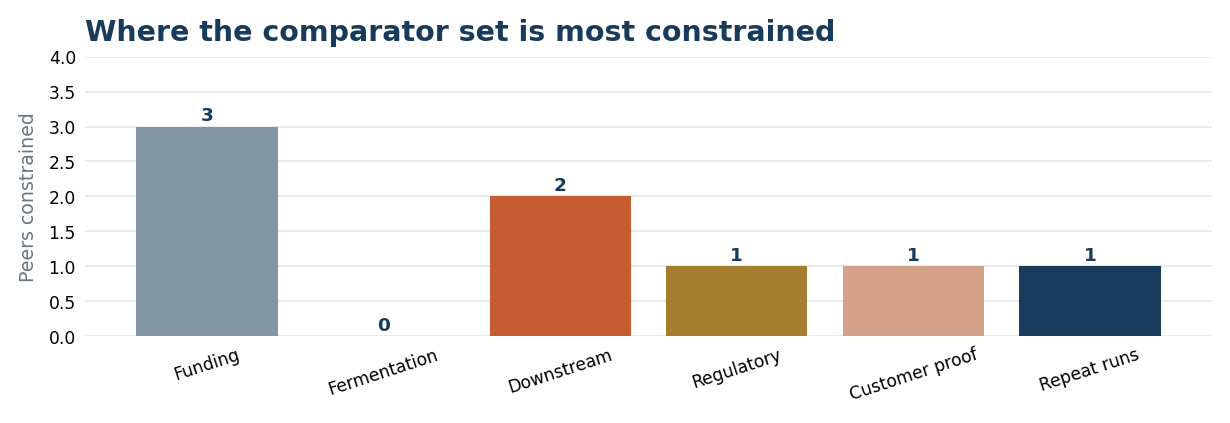
The readiness grid shows strength at every gate. The bottleneck chart summarizes which gate most often limits progress across the comparator set.
What the pattern could mean
Peer D: Balanced evidence across all gates can be more valuable than leadership in one highly visible area.
Peer C: Strong funding cannot establish readiness when repeat production evidence remains weak.
Peer G: Production access may create a strong platform, but customer proof still determines commercial pace.
Scores demonstrate the output logic and are not findings about named companies.
DECISION OUTPUT
Select the response around the limiting gate
RESPONSE | DECISION LOGIC |
|---|---|
Engage | A company shows balanced readiness and its remaining constraint can be resolved within the decision period. |
Partner | The company has a strong ingredient position but needs production, downstream or market access capability. |
Monitor | Progress is credible, but an essential gate lacks near term operating proof. |
Deprioritize | The commercial case depends on several unresolved gates or evidence cannot support the claimed scale path. |
What the client receives
- Eight company comparator register and ingredient boundary
- Evidence ledger across six scale readiness gates
- Production access, downstream and regulatory profiles
- Customer proof timeline by launch market
- Partner, investment and monitoring priorities
Delivery and boundaries
Indicative delivery: Seven to eight weeks for eight peers and four launch markets.
Timing note: Timing varies with ingredient definition, corporate disclosure and the number of regulatory pathways included.
Evidence boundary: Readiness is not inferred from market forecasts, funding or facility capacity alone.
Contact Us
START WITH THE CORPORATE DECISION Tell us which ingredient, launch markets and commercial decision matter. August Research will define the comparator set and scale gates around that requirement.