MARKET SIZING & FORECASTING | ILLUSTRATION 04
Robotic Apple-Thinning Services in Washington, Michigan and Ontario
Sizing annual service demand through compatible acreage, treatment windows and deployable robot capacity.
MARKET QUESTION
What annual service demand could robotic apple thinning reach across Washington State, Michigan and Ontario by 2032?
The commercial decision
How many robot-seasons a service provider should plan, where regional operating bases should be located and what 2032 revenue could be supportable.
Why the market is difficult to size
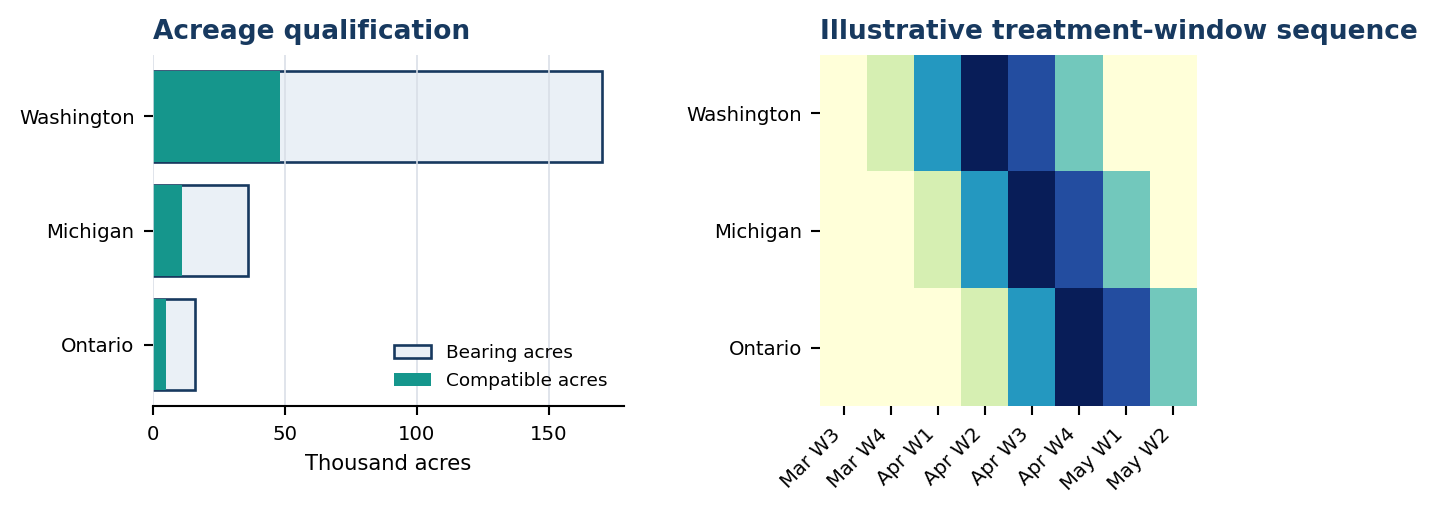
- Bearing acreage is not the same as robot-compatible acreage; canopy form, terrain and row access matter.
- Thinning must occur in a short biological and weather-dependent window, so theoretical demand can exceed deliverable capacity.
- Travel time, uptime, daily productivity and regional bloom timing determine how many acres one fleet can actually serve.
Scope boundary
INCLUDED
EXCLUDED
Per-acre robotic blossom or early fruitlet thinning services for compatible commercial apple orchards in the three named regions.
Robot equipment sales, harvesting, pruning, chemical thinning inputs, non-apple acreage and orchards outside the service radius.
222k
bearing acres screened
32k
base-case acres served in 2032
USD 13.3m
2032 annual service revenue
Illustrative model output. Values demonstrate the analytical structure and are not presented as a published market total.
MODEL ARCHITECTURE
Weather-Constrained Robot-Capacity Model
MODEL EQUATION Minimum of compatible adopted acres and robot-days available x acres per day x field uptime x realised service price
How existing information enters the model
EVIDENCE LAYER | WHAT IS ASSEMBLED | MODEL ROLE |
|---|---|---|
Acreage base | Bearing acreage, orchard density and production regions | Creates the geographic demand ceiling |
Physical compatibility | Canopy system, slope, row geometry and access | Removes acreage the robot cannot serve |
Treatment window | Bloom timing, weather days and regional sequencing | Defines the days available to deliver service |
Fleet productivity | Acres per day, uptime, relocation and service radius | Constrains revenue to deployable capacity |
WHY THIS APPROACH FITS The denominator, eligibility rules, timing mechanism and value logic are specific to this decision. A published headline market is used only as a reasonableness check, never as the calculation route.
ILLUSTRATIVE MODEL OUTPUT
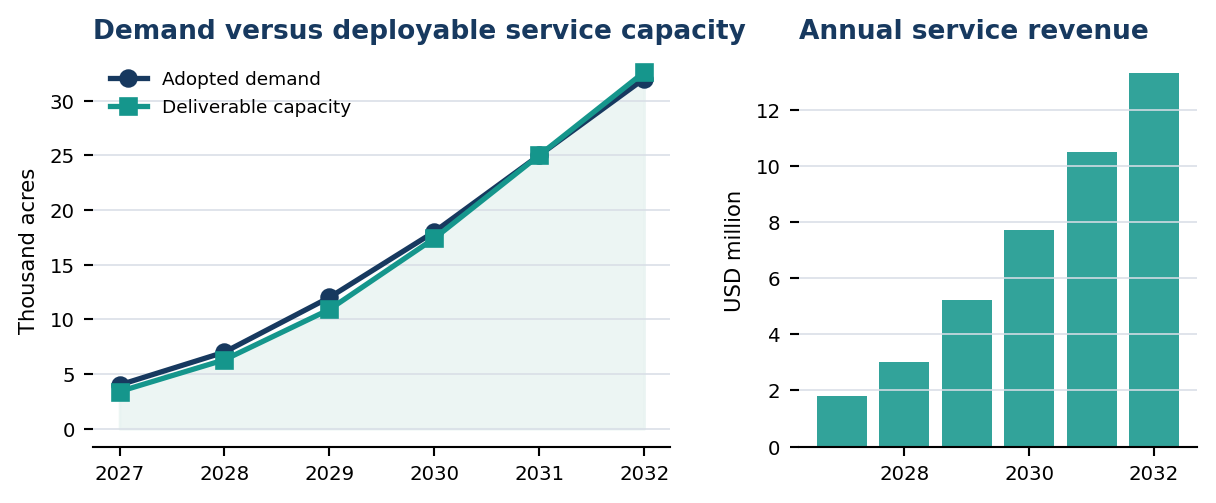
Fleet capacity, not total acreage, governs the early market
What the model indicates
- The model screens 222,000 bearing acres and identifies approximately 64,000 physically compatible acres before adoption is applied.
- Base demand reaches 32,000 serviced acres in 2032, equivalent to about 155 productive robot-seasons under the modelled treatment window.
- At the modelled regional price mix, the 2032 annual service opportunity is USD 13.3 million. Expansion depends on fleet productivity keeping pace with grower adoption.
Scenario range
SCENARIO | MODEL OUTPUT | CONDITION |
|---|---|---|
Downside | 18k acres | Slower performance validation and limited weather days |
Base | 32k acres | 155 robot-seasons deliver the modelled service |
Upside | 46k acres | Higher productivity and stronger grower conversion |
INTERPRETATION The range changes named model parameters. It is not created by adding an arbitrary percentage above and below the base case.
DECISION IMPLICATIONS
What the market model changes
DECISION The service should scale as a regional operations network, with deployment capacity committed only where treatment windows can be sequenced.
Recommended commercial response
- Locate operating bases around dense compatible acreage, not total state or provincial production.
- Use bloom timing differences to sequence the fleet across regions and extend productive days.
- Track acres delivered per robot-day as the leading commercial metric before expanding sales coverage.
Uncertainty and refresh triggers
TRIGGER | WHY IT MATTERS |
|---|---|
Acres per robot-day | Changes fleet capacity directly |
Weather-compatible days | Changes the serviceable seasonal window |
Grower conversion | Changes adopted compatible acreage |
Realised price per acre | Changes annual service revenue |
What August Research would deliver
- Compatible-acreage model
- Regional treatment-window calendar
- Robot-season capacity forecast
- 2032 demand and revenue scenarios
CONTACT US Tell us which market decision must be supported, the scope currently being counted and where available estimates fail to explain the opportunity. August Research will build the boundary, evidence routes and forecast around that decision.