MARKET SIZING & FORECASTING | ILLUSTRATION 02
Whey Concentration and Water Recovery at EU Cheese Plants
Estimating the serviceable market from plant process streams, operating pressure and investment economics.
MARKET QUESTION
How large is the serviceable EU market for modular whey-concentration and water-recovery systems at small and mid-sized cheese plants?
The commercial decision
Which plant archetypes and national markets justify a modular product configuration, partner network and five-year installation plan.
Why the market is difficult to size
- The number of dairies overstates demand because micro-producers and highly integrated plants require different solutions.
- Whey volume, current disposal route, cleaning-water load and available utilities determine whether a modular system can operate economically.
- Cheese output alone does not indicate investment urgency; water stress, disposal cost and energy economics also matter.
Scope boundary
INCLUDED
EXCLUDED
Modular membrane concentration, water-recovery equipment, balance-of-system integration and commissioning for qualifying small and mid-sized cheese plants.
Large central whey processors, greenfield dairy construction, ingredient-production revenue and stand-alone wastewater treatment with no whey recovery.
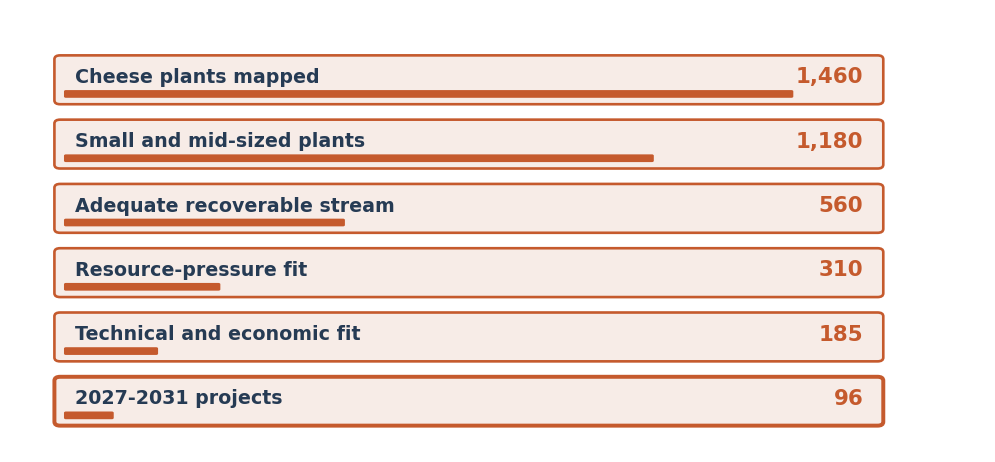
1,460
plants initially mapped
96
base-case projects through 2031
EUR 88.9m
five-year serviceable market
Illustrative model output. Values demonstrate the analytical structure and are not presented as a published market total.
MODEL ARCHITECTURE
Plant Process-Stream Qualification Model
MODEL EQUATION Plant universe x cheese throughput x recoverable whey stream x water-pressure score x technical fit x investment window x project value
How existing information enters the model
EVIDENCE LAYER | WHAT IS ASSEMBLED | MODEL ROLE |
|---|---|---|
Plant structure | Facility lists, ownership, product mix and throughput indicators | Separates relevant plants from broad dairy counts |
Process streams | Cheese output, whey handling, cleaning cycles and water use | Estimates recoverable volume and system loading |
Economic pressure | Water cost, disposal route, energy exposure and local constraints | Identifies where recovery solves a real operating problem |
Investment fit | Existing utilities, footprint, modularity and payback thresholds | Translates technical possibility into serviceable demand |
WHY THIS APPROACH FITS The denominator, eligibility rules, timing mechanism and value logic are specific to this decision. A published headline market is used only as a reasonableness check, never as the calculation route.
ILLUSTRATIVE MODEL OUTPUT
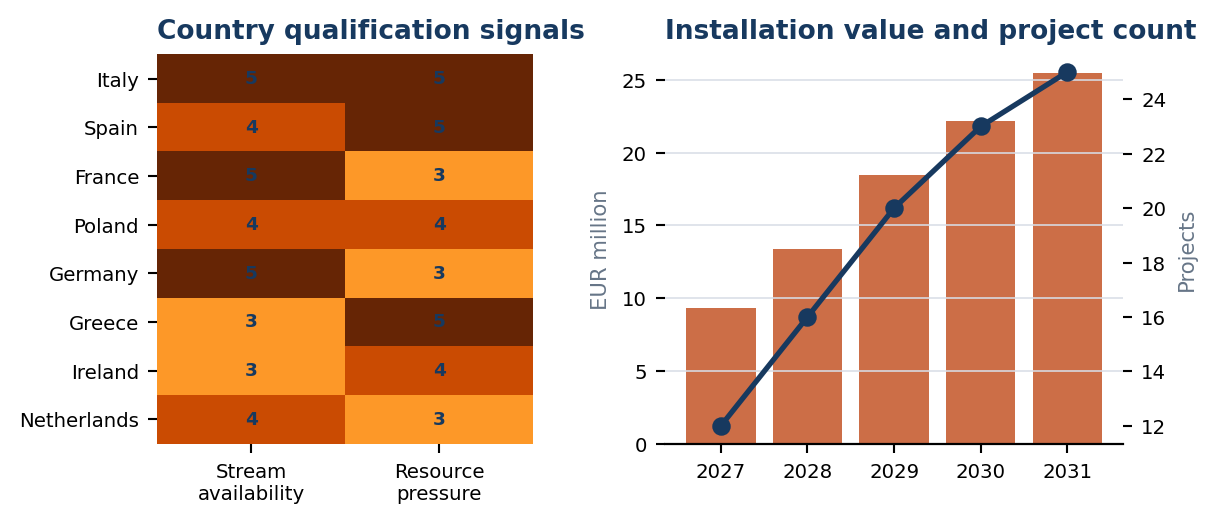
Resource pressure changes the country priority order
What the model indicates
- The base model narrows 1,460 mapped plants to 185 technically and economically suitable sites, then places 96 projects in the 2027-2031 investment window.
- The resulting cumulative market is EUR 88.9 million, with project value varying by stream volume and integration complexity.
- Markets with the largest cheese output are not automatically first: fragmented plant structure and water or disposal pressure can create stronger modular demand.
Scenario range
SCENARIO | MODEL OUTPUT | CONDITION |
|---|---|---|
Downside | EUR 72m | Longer payback thresholds and slower partner coverage |
Base | EUR 88.9m | 96 qualifying projects enter the five-year window |
Upside | EUR 109m | Higher disposal pressure and broader finance availability |
INTERPRETATION The range changes named model parameters. It is not created by adding an arbitrary percentage above and below the base case.
DECISION IMPLICATIONS
What the market model changes
DECISION The launch case should be organised around high-pressure plant archetypes, not an EU-wide dairy sales list.
Recommended commercial response
- Package the offer by whey-volume band and existing disposal route.
- Build partner coverage first in markets where modular plants are numerous and resource pressure is visible.
- Use payback and utility-fit evidence to qualify accounts before allocating detailed engineering effort.
Uncertainty and refresh triggers
TRIGGER | WHY IT MATTERS |
|---|---|
Water and disposal cost | Changes project economics |
Plant consolidation | Changes the addressable facility universe |
Energy price | Changes concentration operating cost |
Funding availability | Moves qualified plants into the investment window |
What August Research would deliver
- Plant archetype universe
- Process-stream eligibility model
- Country priority heatmap
- Five-year installation and revenue forecast
CONTACT US Tell us which market decision must be supported, the scope currently being counted and where available estimates fail to explain the opportunity. August Research will build the boundary, evidence routes and forecast around that decision.