R&D & INNOVATION / SECONDARY RESEARCH / PHASE 2 / MINING + ROBOTICS
Autonomous inspection systems for harsh underground environments
A detailed hypothetical trend-analysis engagement.
INDUSTRY
Mining + Robotics
SIGNALS
12+ indicators
OUTPUT
Decision lanes
TIMELINE
Illustrative 5-7 weeks
The challenge
A mining-technology team needs to understand which sensing, locomotion, communications and safety capabilities are becoming credible for post-blast inspection, water-ingress checks and hazardous-area reconnaissance. Generic autonomous-robot claims are not sufficient because conditions and mine-approval dependencies vary sharply.
WHY THE QUESTION IS TIMELY
The external environment is changing quickly. The study would treat regulatory, market, customer and technology developments as dated signals, then test whether they converge around the client’s specific application and decision boundary.
How the research would be executed
Define the technical system, use case, geography, time horizon and technical exclusions.
Search and code events across science, IP, products, partnerships, regulations, capital and ecosystem activity.
Check source independence, technical relevance, date, application context and evidence quality.
Identify acceleration, weak signals, contradictions, decision implications and reassessment triggers.
Observable signals reviewed
Signals are coded by mission, environmental condition, robotic subsystem, demonstration setting, task completion, communication method, safety approach, developer ecosystem, pilot activity and relevant approval or certification context.
Science + IP
Technical evidence and patent trajectory.
Translation
Pilots, products, validation and scale-up.
Ecosystem
Partners, funding, M&A and portfolio movement.
Regulation + standards
Requirements, guidance, test methods and policy.
Demand + adoption
Procurement, workflow, customer and replacement signals.
Evidence quality
Rate of change, persistence and corroboration.
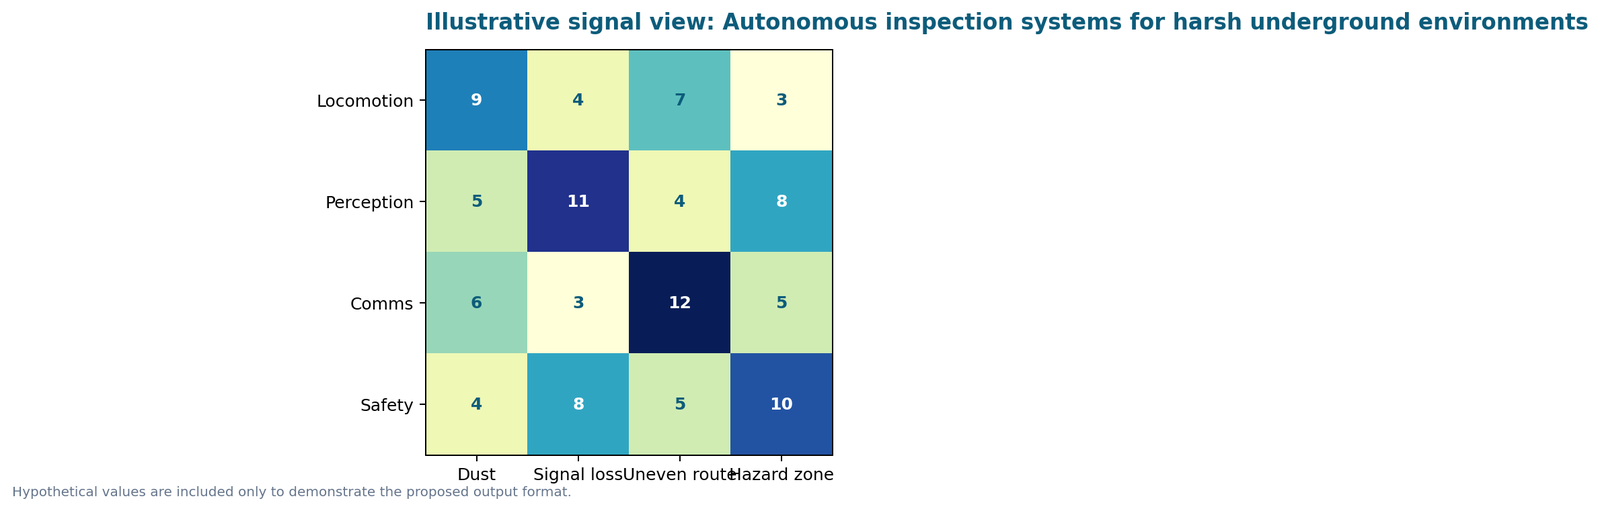
Illustrative visual output
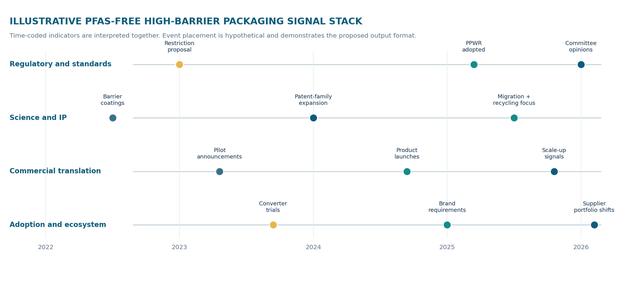
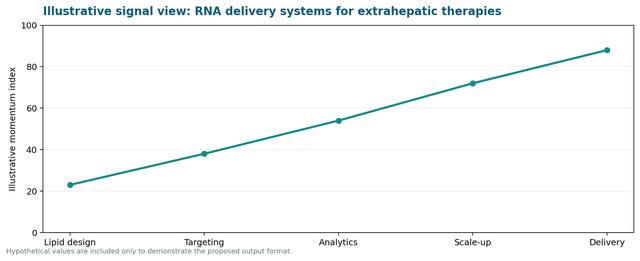
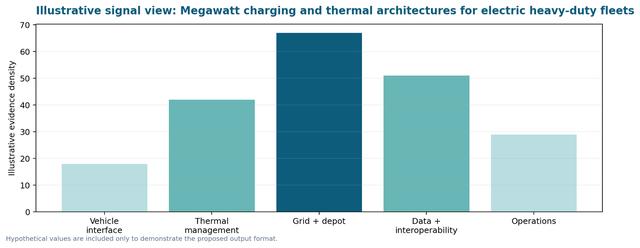
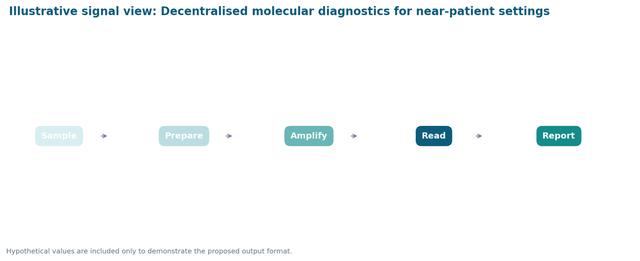
This example uses a distinct visual form so the engagement can be understood at a glance without repeating the Phase 1 service-page horizon.
What the decision output might say
The output could identify mission-specific capability clusters, where evidence transfers directly to underground conditions and where a field validation question remains open.
WEBSITE PRESENTATION SUGGESTION
An operating-condition evidence matrix. Users select a mission and see the subsystem evidence, gaps and next validation question.
Illustrative delivery package
- A dated, coded evidence database with source links, technical tags, organisation fields and confidence labels.
- A trend workbook showing rate of change, convergence, gaps and event-level signals across the selected evidence families.
- A decision presentation translating each technical route into act, build evidence, monitor or watchlist lanes.
- A focused shortlist of developers, partners, suppliers or research organisations for follow-on scouting or primary research.
Let's discuss your project
August Research can tailor this trend-analysis structure to the application, technical evidence and roadmap decision in front of your team.
Note: This is a hypothetical website example, not a client engagement or a finding about a technology, organisation or regulatory outcome. All values, record counts and timings are illustrative.