R&D & INNOVATION / SECONDARY RESEARCH / PHASE 2
PFAS-free high-barrier packaging
A regulation-led trend analysis for deciding which barrier technologies deserve R&D attention as food-contact, recycling and performance expectations evolve.
DECISION
Prioritise technology routes
SCOPE
Food and consumer packaging
SIGNALS
16 event-level indicators
TIMELINE
Illustrative 5-week study
The hypothetical client question
A European packaging-materials team is deciding how to direct its next coating-development programme. The immediate question is not whether every PFAS-free solution is viable. It is which non-fluorinated barrier routes are showing enough technical, commercial and regulatory momentum to justify formulation work, supplier engagement or external validation for grease-resistant food-contact paper and flexible-packaging structures.
The team needs to compare water-based dispersions, bio-based or synthetic polymer barriers, inorganic or hybrid coatings, and multilayer approaches. The decision depends on barrier performance, heat-seal and conversion compatibility, migration and food-contact evidence, recyclability, runnability, cost direction and the availability of credible material and converter partners.
WHY THIS IS A LIVE TREND QUESTION
PFAS used in oil-resistant paper and cardboard food-contact materials are under regulatory and market scrutiny. ECHA’s broad PFAS restriction process and the EU packaging framework create a moving context. The illustration treats those developments as drivers to monitor, not as a substitute for product-specific legal, safety or compliance assessment.
Research scope and evidence boundary
INCLUDED
Barrier coatings and treatments for paper, board and flexible structures; food-contact and non-food applications kept distinct; performance, process and end-of-life evidence; materials, equipment, converters and brand activity.
EXCLUDED
A legal opinion on PFAS restrictions, food-contact authorisation, migration compliance or an assertion that a route meets recyclability requirements. Those require scope-specific specialist review and, where needed, testing.
How the trend analysis would be executed
Define target formats, grease and moisture barrier need, coating weight, conversion processes, food-contact exposure, geographic focus and incumbent chemistry.
Create linked searches across papers, patent families, conference activity, supplier portfolios, launches, pilots, partnerships, regulations, standards and customer requirements.
Date-code each record by technology route, application, evidence type, organisation, geography, performance context, source independence and confidence.
Examine rate of change, persistence and convergence across science, IP, commercial translation and ecosystem signals. Separate activity from corroborated advance.
Position routes as act now, build evidence, monitor or watchlist. State the technical or regulatory trigger that would justify moving a route between lanes.
Observable indicators and research logic
The study does not treat a document count as evidence of a trend. The following event-level indicators are reviewed together, then interpreted against the technical and application context.
PATENT FILINGS
Family expansion, claims, assignees and geography.
SCIENTIFIC OUTPUT
Papers, preprints, citations and reported test context.
CONFERENCES
Abstracts, technical sessions, demonstrations and exhibitor activity.
STANDARDS AND POLICY
Draft standards, restrictions, guidance and test methods.
PRODUCT LAUNCHES
New formats, specifications and application claims.
PILOTS AND TRIALS
Converter trials, customer tests, qualification and performance evidence.
PARTNERSHIPS
Joint development, licensing, supply agreements and consortia.
CAPACITY SIGNALS
Pilot lines, plant investment, equipment orders and scale-up.
FUNDING AND GRANTS
Venture rounds, public programmes and strategic investment.
M&A AND PORTFOLIO MOVES
Acquisitions, divestitures, corporate venture and portfolio repositioning.
ECOSYSTEM ACTIVITY
New entrants, material suppliers, coaters, equipment providers and specialist labs.
DEMAND AND ADOPTION
Brand requirements, tenders, procurement signals and replacement activity.
RATE OF CHANGE
Acceleration, persistence, recurrence and timing of events.
TECHNICAL ADVANCE
Barrier, migration, runnability, cost, coat weight or integration evidence.
APPLICATION FIT
Evidence tied to the target format, substrate and operating condition.
EVIDENCE QUALITY
Source independence, recency, technical specificity and corroboration.
Note: This is a hypothetical engagement concept for website illustration. It is not a client project or a finding about any particular technology, company, product or regulatory outcome. All numerical values, timelines, event placements and outputs are illustrative.
Note: The illustrative five-week timeline depends on the breadth of the technology taxonomy, source accessibility, geographic coverage and the depth of organisation profiling. Actual secondary-research timing is scope dependent.
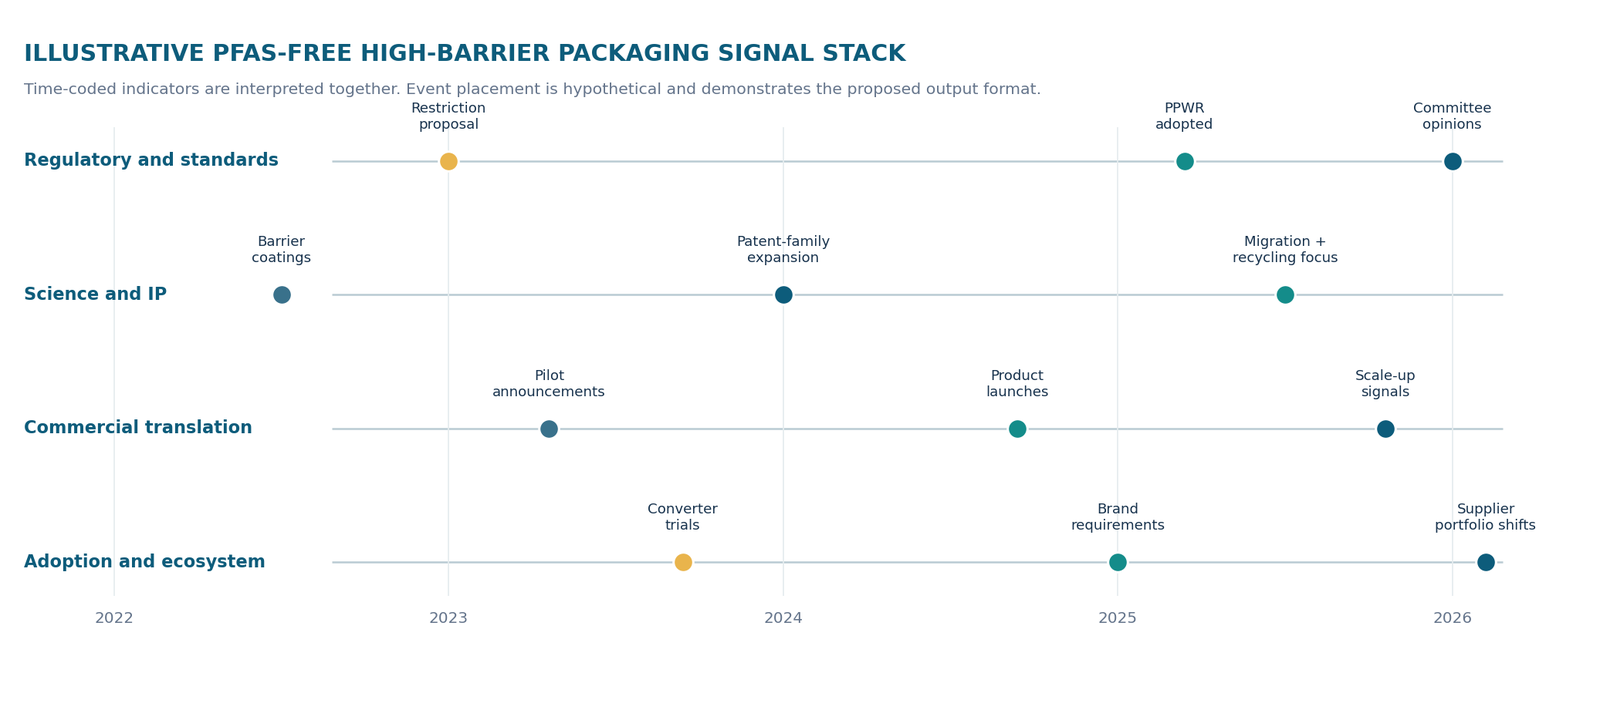
Illustrative signal stack
This visual shows how apparently separate events can be viewed as a connected pattern. The analysis would retain the underlying records so that a client can see why a route was classified as accelerating, emerging or still uncertain.
Hypothetical decision output
BUILD EVIDENCE
Water-based or hybrid coating routes with target-format test data but incomplete migration, recycling or conversion evidence.
MONITOR
Polymer and multilayer concepts with growing IP and commercial attention but inconsistent application evidence.
WATCHLIST
Early concepts with publication or patent activity that has not yet translated into relevant product, pilot or ecosystem signals.
What the illustrative delivery could include
- A coded secondary-research database of approximately 160 to 220 source records, with source links, date, technology route, application, evidence type, organisation and confidence fields.
- A time-coded trend workbook showing signal rate, convergence and gaps across regulations, science, IP, launches, partnerships, portfolio changes and adoption evidence.
- A decision presentation setting out the application-specific routes to advance, monitor or keep on a watchlist, plus the technical questions that need validation.
- A shortlist of potential material, coating, conversion, testing or equipment organisations for follow-on technology scouting or primary research.
WEBSITE PRESENTATION SUGGESTION
Use the multi-lane signal stack as the page’s main visual. A visitor can turn individual lanes on and off, then open a date-stamped event card. Add a separate “why it matters” drawer for each signal and retain a visible distinction between observed event, interpretation and recommended action.
Let's discuss your project
August Research can structure a packaging-trend analysis around the formats, performance constraints and development decisions most relevant to your team.