R&D & INNOVATION / SECONDARY RESEARCH / PHASE 2 / COMMERCIAL VEHICLES + TRANSPORTATION
Megawatt charging and thermal architectures for electric heavy-duty fleets
A detailed hypothetical trend-analysis engagement.
INDUSTRY
Commercial Vehicles + Transportation
SIGNALS
12+ indicators
OUTPUT
Decision lanes
TIMELINE
Illustrative 5-7 weeks
The challenge
A commercial-vehicle team needs to decide which charging, connector, cooling, power-electronics and depot-control trends should inform a future vehicle and infrastructure roadmap. The issue is not connector power alone: duty cycle, grid connection, vehicle thermal load, interoperability, depot dwell time and public-corridor deployment all affect relevance.
WHY THE QUESTION IS TIMELY
The external environment is changing quickly. The study would treat regulatory, market, customer and technology developments as dated signals, then test whether they converge around the client’s specific application and decision boundary.
How the research would be executed
Define the technical system, use case, geography, time horizon and technical exclusions.
Search and code events across science, IP, products, partnerships, regulations, capital and ecosystem activity.
Check source independence, technical relevance, date, application context and evidence quality.
Identify acceleration, weak signals, contradictions, decision implications and reassessment triggers.
Observable signals reviewed
The analysis tracks charging-product launches, connector and cooling specifications, fleet pilots, depot projects, grid partnerships, charging-station deployment, funding, regulations, interoperability rules, procurement activity and operating-data claims.
Science + IP
Technical evidence and patent trajectory.
Translation
Pilots, products, validation and scale-up.
Ecosystem
Partners, funding, M&A and portfolio movement.
Regulation + standards
Requirements, guidance, test methods and policy.
Demand + adoption
Procurement, workflow, customer and replacement signals.
Evidence quality
Rate of change, persistence and corroboration.
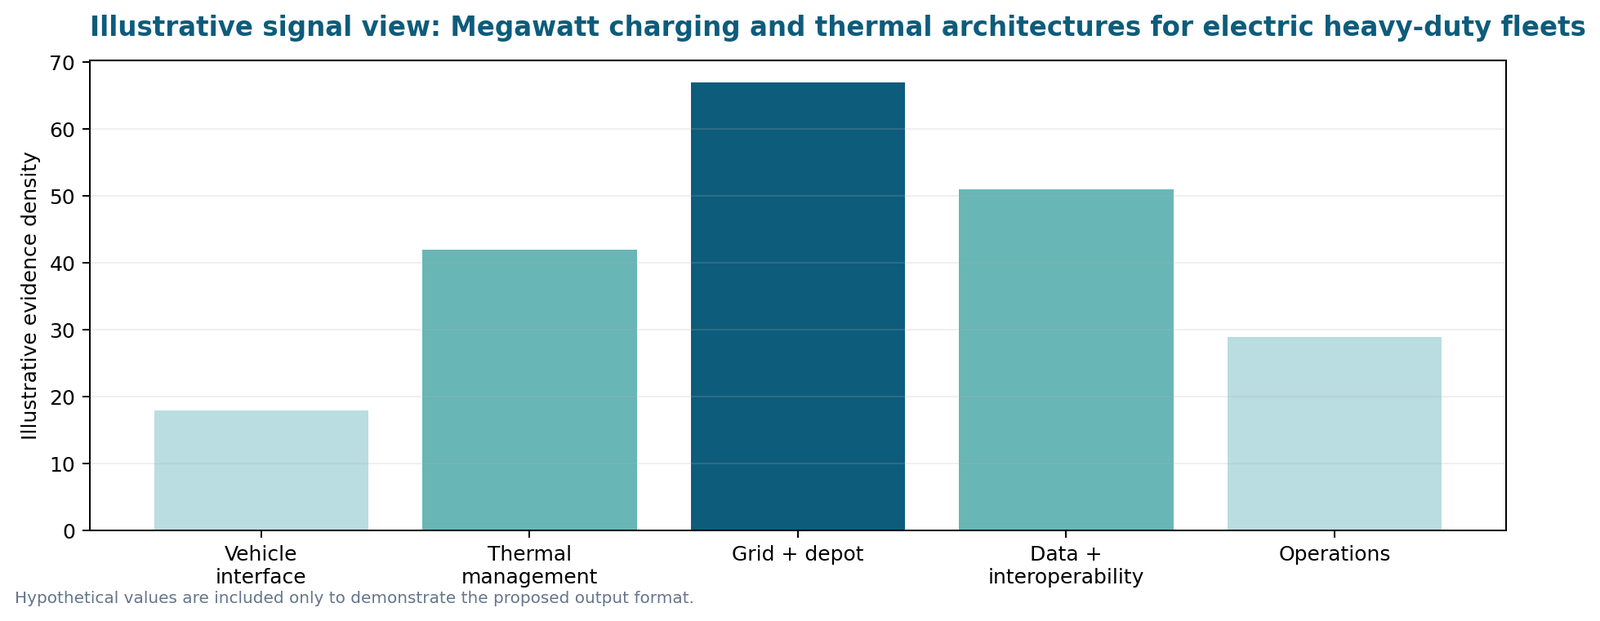
Illustrative visual output
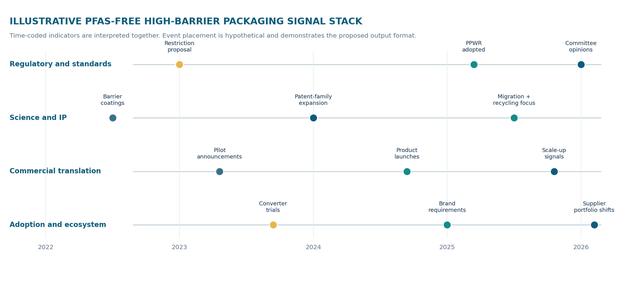
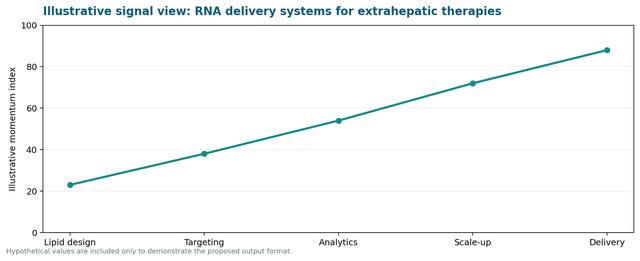
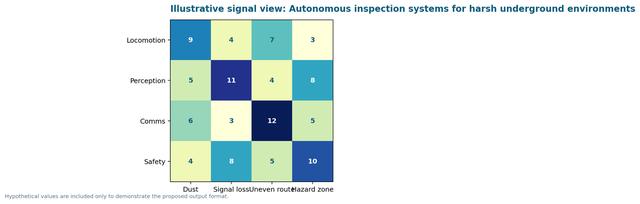
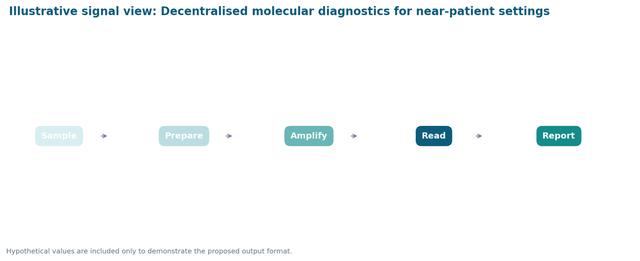
This example uses a distinct visual form so the engagement can be understood at a glance without repeating the Phase 1 service-page horizon.
What the decision output might say
The result could separate trends already supported by deployment and interoperability evidence from high-power concepts whose operational and grid-integration evidence is still limited.
WEBSITE PRESENTATION SUGGESTION
A systems-evidence bar chart, with each bar opening into vehicle, depot, grid and operations evidence rather than a single technology score.
Illustrative delivery package
- A dated, coded evidence database with source links, technical tags, organisation fields and confidence labels.
- A trend workbook showing rate of change, convergence, gaps and event-level signals across the selected evidence families.
- A decision presentation translating each technical route into act, build evidence, monitor or watchlist lanes.
- A focused shortlist of developers, partners, suppliers or research organisations for follow-on scouting or primary research.
Let's discuss your project
August Research can tailor this trend-analysis structure to the application, technical evidence and roadmap decision in front of your team.
Note: This is a hypothetical website example, not a client engagement or a finding about a technology, organisation or regulatory outcome. All values, record counts and timings are illustrative.