R&D & INNOVATION / SECONDARY RESEARCH / PHASE 2 / MEDICAL DEVICES + DIAGNOSTICS
Decentralised molecular diagnostics for near-patient settings
A detailed hypothetical trend-analysis engagement.
INDUSTRY
Medical Devices + Diagnostics
SIGNALS
12+ indicators
OUTPUT
Decision lanes
TIMELINE
Illustrative 5-7 weeks
The challenge
A diagnostics team needs to understand which sample-preparation, cartridge, amplification, detection and workflow innovations are making molecular testing more practical outside central laboratories. The analysis focuses on intended-use expansion, not a generic ranking of diagnostic platforms.
WHY THE QUESTION IS TIMELY
The external environment is changing quickly. The study would treat regulatory, market, customer and technology developments as dated signals, then test whether they converge around the client’s specific application and decision boundary.
How the research would be executed
Define the technical system, use case, geography, time horizon and technical exclusions.
Search and code events across science, IP, products, partnerships, regulations, capital and ecosystem activity.
Check source independence, technical relevance, date, application context and evidence quality.
Identify acceleration, weak signals, contradictions, decision implications and reassessment triggers.
Observable signals reviewed
The research time-codes peer-reviewed performance evidence, patents, clinical studies, product launches, regulatory milestones, reimbursement and procurement signals, partnerships, manufacturing and consumable-supply activity, and user-workflow evidence.
Science + IP
Technical evidence and patent trajectory.
Translation
Pilots, products, validation and scale-up.
Ecosystem
Partners, funding, M&A and portfolio movement.
Regulation + standards
Requirements, guidance, test methods and policy.
Demand + adoption
Procurement, workflow, customer and replacement signals.
Evidence quality
Rate of change, persistence and corroboration.
Illustrative visual output
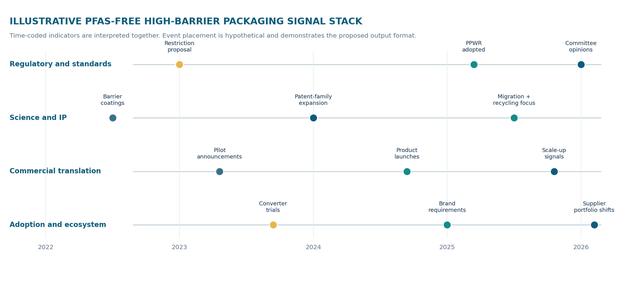
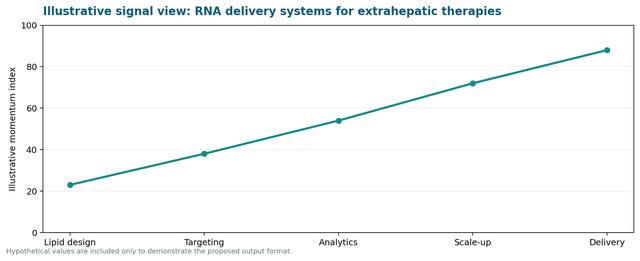
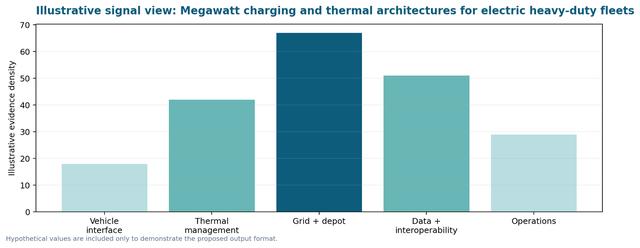
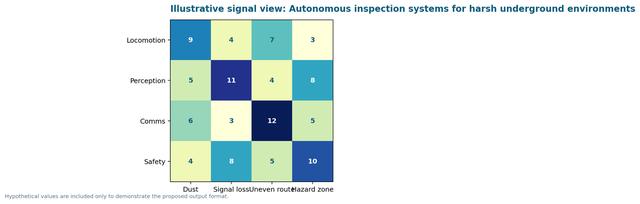
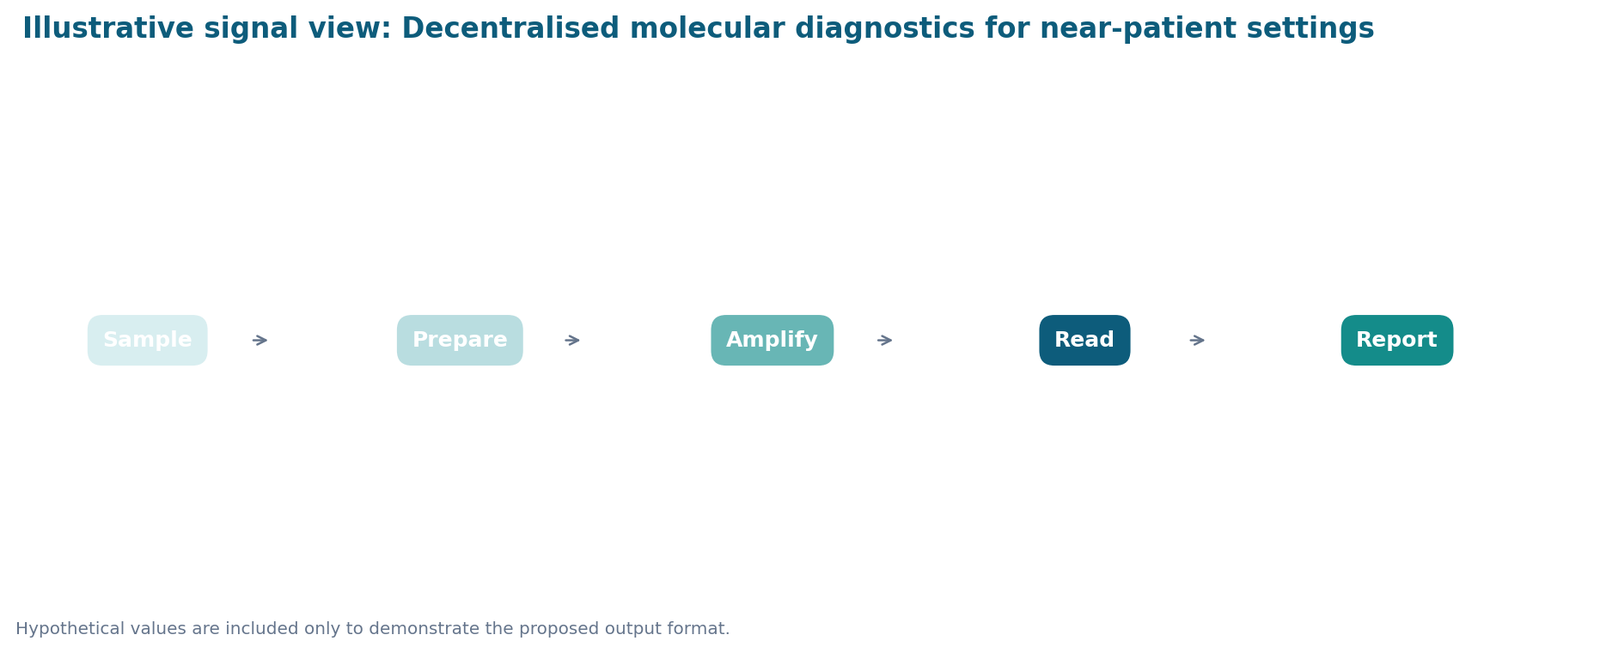
This example uses a distinct visual form so the engagement can be understood at a glance without repeating the Phase 1 service-page horizon.
What the decision output might say
The decision view could distinguish well-supported platform changes from attractive technical concepts that still lack sample-to-answer workflow, usability, quality-control or intended-use evidence.
WEBSITE PRESENTATION SUGGESTION
A clinical-workflow signal map that follows sample, preparation, assay, readout and reporting stages, with evidence cards at each stage.
Illustrative delivery package
- A dated, coded evidence database with source links, technical tags, organisation fields and confidence labels.
- A trend workbook showing rate of change, convergence, gaps and event-level signals across the selected evidence families.
- A decision presentation translating each technical route into act, build evidence, monitor or watchlist lanes.
- A focused shortlist of developers, partners, suppliers or research organisations for follow-on scouting or primary research.
Let's discuss your project
August Research can tailor this trend-analysis structure to the application, technical evidence and roadmap decision in front of your team.
Note: This is a hypothetical website example, not a client engagement or a finding about a technology, organisation or regulatory outcome. All values, record counts and timings are illustrative.