R&D & INNOVATION / SECONDARY RESEARCH
Electrochemical CO₂ Capture for Variable Cement Flue Gas
Emerging Technology Assessment | CCUS and cement manufacturing
DECISION QUESTION Does the available evidence justify moving an electrochemical capture concept into a site-relevant cement kiln slipstream pilot, or should the organisation first close oxygen, impurity, durability and integration gaps?
The situation
A cement producer is evaluating whether electrochemical carbon capture could reduce reliance on steam-intensive solvent regeneration and create a more modular route to post-combustion capture. The concept is attractive because electrical regeneration may align with a growing renewable power portfolio. The difficulty is that laboratory success does not automatically transfer to a kiln line where gas composition changes with feed chemistry, fuel mix, false-air ingress, raw mill operation, bypass conditions and air-pollution-control performance.
The strategic pressure is credible. The International Energy Agency identifies CCUS as necessary for deep cement-sector reductions and its net-zero pathway reaches 170 Mt of CO₂ captured from cement by 2030. In Europe, the definitive Carbon Border Adjustment Mechanism began on 1 January 2026 and is aligned with the gradual replacement of free EU ETS allocation for cement and other covered sectors. These drivers strengthen the case for assessing options now, but they do not make an immature option site-ready.
Why the question cannot be answered by a readiness score alone
- Cement flue gas can offer a relatively high CO₂ partial pressure, but oxygen, water, acidic gases and residual dust may alter redox chemistry, electrode life, membrane stability and balance-of-plant requirements.
- Published performance may be measured in simulated gas, short campaigns or small cyclic cells, while a site decision depends on continuous operation, impurity excursions, cleaning and stack replacement.
- A low thermal duty is not automatically a low total energy burden. Electricity, compression, gas conditioning, pumping, cooling and CO₂ polishing must be compared on a consistent basis.
- The relevant decision is conditional: pursue, validate first, partner, monitor or set aside for this kiln line and time horizon.
WORKING PREMISE The engagement is structured to test transferability of evidence. It is not designed to declare electrochemical capture universally superior to amines, membranes, calcium looping, oxy-fuel or other capture routes.
ENGAGEMENT DEFINITION
A technically bounded scope
The assessment begins with a hypothetical kiln-line envelope so every source can be screened against the same conditions. These values are working inputs for the example and would be replaced by plant historian data, stack-test records and the client’s engineering constraints in a live engagement.
Parameter | Working project input | Why it matters |
|---|---|---|
Kiln system | Dry-process preheater and precalciner line; approximately 3,000 t clinker/day | Defines flue-gas origin, scale and integration point. |
Gas flow | Approximately 250,000 Nm³/h after existing particulate control | Sets contactor, stack, ducting and compression scale. |
CO₂ | 18 to 25 dry vol% | Affects capture driving force, capacity and equipment sizing. |
O₂ | 6 to 10 dry vol% | Can compete with or degrade oxygen-sensitive redox carriers. |
SO₂ / NOₓ | 20 to 200 ppm SO₂; 200 to 600 ppm NOₓ | May create side reactions, irreversible binding or pretreatment demand. |
Dust and moisture | Post-control dust target at or below 10 mg/Nm³; moisture retained unless the process requires drying | Influences electrode fouling, electrolyte balance and gas conditioning. |
Decision horizon | Select a validation pathway within 12 months; commercial retrofit decision later | Prevents early evidence from being interpreted as a procurement decision. |
Performance intent | Screen for a credible route toward 85 to 90% capture with storage-ready CO₂ | Creates a decision threshold without assuming it has been met. |
Research boundary
The technology boundary covers electrochemically driven CO₂ capture and release, including redox-active carriers or electrodes, electro-swing adsorption and pH-swing architectures. Direct electrochemical conversion of flue gas is reviewed only as adjacent evidence because its product, reactor physics and performance measures differ from separation and release of a concentrated CO₂ stream.
The comparison baseline
The assessment compares evidence against a defined post-combustion benchmark, not against an undefined “conventional capture” category. A 2024 cement study reported approximately 2.6 GJ/t CO₂ regeneration duty for a PZ-AMP amine configuration at 99.7% simulated capture. That result is used as a technical reference point, not as a guaranteed site value. Electrical and thermal energy are retained separately before any primary-energy or cost conversion.
BOUNDARY RULE Results from electrochemical CO₂ reduction, direct air capture or power-sector flue gas are not treated as cement-capture proof. They can reveal mechanisms and risks, but application transfer must be demonstrated.
HOW THE RESEARCH IS EXECUTED
Seven evidence modules, one decision trail
1. DECISION PROTOCOL Define the capture objective, tie-in point, baseline, decision horizon, must-meet constraints and evidence status language.
2. TECHNOLOGY TAXONOMY Separate redox-carrier solvents, electro-swing adsorption, pH-swing cells, membrane-assisted systems and adjacent conversion routes.
3. DEMONSTRATION RECORD Extract gas composition, pressure, temperature, current density, cycle time, capacity, selectivity, energy basis, duration, degradation and scale from each source.
4. CONDITION TRANSFER Compare every demonstration with the site window for CO₂, O₂, water, SO₂, NOₓ, dust, load variation and upstream gas conditioning.
5. NORMALISED BENCHMARK Keep capture fraction, CO₂ purity, electricity, thermal duty, compression, consumables, capacity fade and equipment scale on traceable bases.
6. DEPLOYMENT DEPENDENCIES Map developers, patent ownership, pilot history, stack manufacturing, membrane or carrier supply, required pretreatment, utilities and CO₂ export requirements.
7. ACTION GATE Classify the technology as pursue, validate first, explore partnership, monitor with triggers or set aside, and state exactly what could change that decision.
Evidence extraction fields
Evidence field | What is recorded | Common interpretation error prevented |
|---|---|---|
Gas basis | Dry or wet basis, balance gas, contaminants, pressure and temperature | Comparing unlike feed conditions. |
System boundary | Capture only, capture plus release, compression, purification and auxiliary loads | Calling a partial energy value a system energy value. |
Performance basis | Moles captured, capture fraction, purity, Faradaic or electron utilisation, current density and cycle time | Treating electrochemical efficiency as capture rate. |
Durability | Continuous hours, cycles, capacity retention, failure mode and recovery | Extrapolating a short stable run to industrial availability. |
Evidence independence | Peer-reviewed result, patent example, developer claim, grant milestone or operating record | Counting repeated company claims as corroboration. |
WHAT THE EVIDENCE INDICATES
Promising oxygen stability, limited cement transfer proof
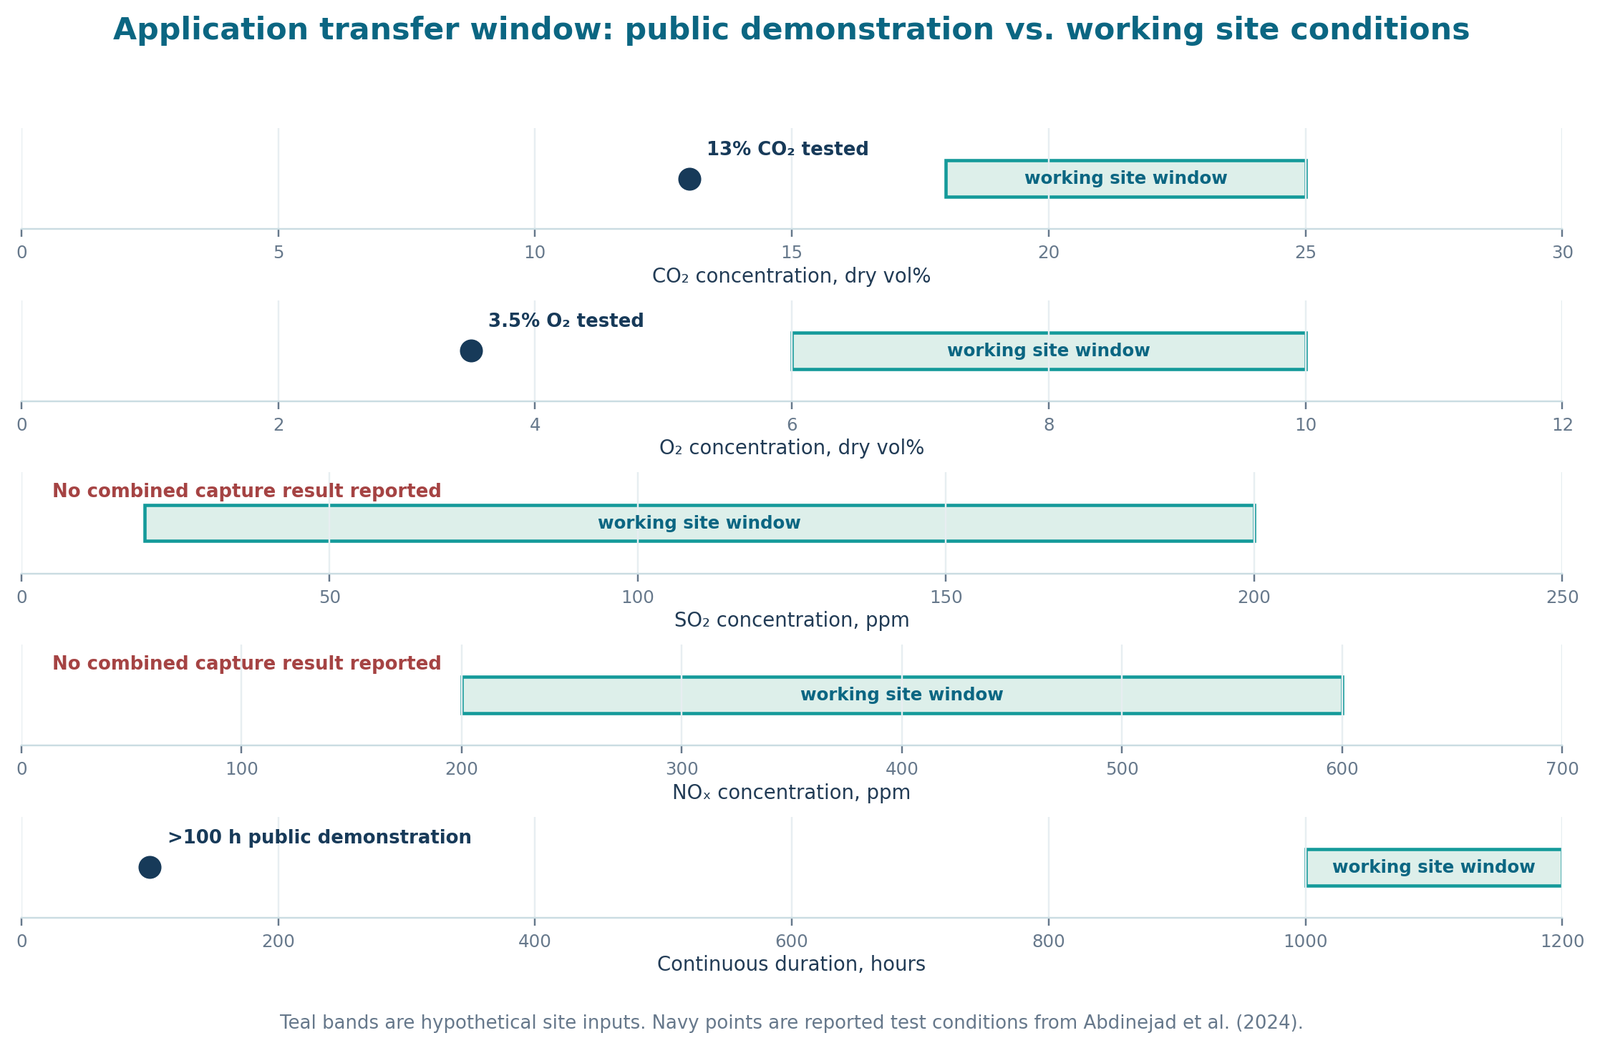
A 2024 open-access study demonstrated an oxygen-stable heterocyclic quinone in a cyclic electrochemical capture system using simulated gas containing 13% CO₂ and 3.5% O₂. The system operated for more than 100 hours with reported electron utilisation of 0.83 and no significant degradation. This is material progress because oxygen instability has been a known limitation for quinone-based capture.
However, the reported condition does not yet cover the working cement envelope in this example. Oxygen is lower than the assumed 6 to 10% site range, and the public result does not establish combined tolerance to cement-relevant SO₂, NOₓ, humidity and residual dust. The duration also remains far below a campaign that could support assumptions about industrial maintenance or replacement intervals.
Adjacent evidence is useful, but must stay in its lane
Studies of direct electrochemical CO₂ conversion show why impurities deserve explicit treatment. One 2024 study reported more than 90% Faradaic efficiency for CO or formate over 20 hours with 200 ppm SO₂ or NO in the feed, while adding 1% O₂ materially reduced carbon-product efficiency because of competing oxygen reduction. A separate Nature Communications study used acidic media to suppress oxygen reduction and achieved 46.5% multicarbon Faradaic efficiency at 200 mA/cm² with 24 hours of stability. These findings are mechanistically relevant, but they do not validate a capture-and-release process or cement-site durability.
Evidence status by decision dimension
Dimension | Status | Interpretation for this engagement |
|---|---|---|
CO₂ capture mechanism | Observed | Electrochemically controlled capture and release is supported at laboratory scale. |
Oxygen tolerance | Conditional | Promising at 3.5% O₂ for more than 100 hours; the site range is higher. |
Combined impurity tolerance | Unresolved | No directly transferable public proof for O₂, SO₂, NOₓ, moisture and dust together. |
Long-duration durability | Unresolved | Public duration does not support assumptions for stack life or maintenance. |
Cement integration | Unresolved | Pretreatment, tie-in, turndown, compression and CO₂ polishing remain application questions. |
Regulatory relevance | Corroborated | CBAM and EU ETS changes increase the value of credible decarbonisation options, not their readiness. |
INTERPRETATION DISCIPLINE A higher cement-flue-gas CO₂ concentration may improve capture driving force, but it cannot be assumed to compensate for higher oxygen or untested contaminants. Each effect requires evidence at the relevant system boundary. | ||
VISUAL OUTPUT
The application transfer window
The principal visual output places the strongest directly relevant public demonstration beside the working site conditions. It avoids compressing unlike evidence into a single maturity score and shows why a technology can be scientifically credible but not yet ready for a site-relevant pilot.
What the visual changes in the decision
- CO₂ concentration is not the principal reason to pause. The larger gaps are oxygen coverage, mixed contaminants, duration and scale.
- The evidence does not support jumping from a laboratory cyclic-flow result to a full kiln slipstream campaign without an intermediate mixed-gas durability step.
- The next research question becomes specific: which developer or architecture can document performance at the full condition set, and what pretreatment would be required?
- A future evidence update can move each marker as new independent results, longer demonstrations or cement-specific pilots become available.
WEBSITE PRESENTATION SUGGESTION Use an interactive Condition Coverage Strip. Visitors can toggle between Public Evidence, Site Requirement and Transfer Gap. Hovering over a marker reveals the source, test duration and system boundary. Selecting a gap opens the evidence needed to cross the next decision gate. On mobile, stack the five condition strips vertically with one evidence card expanded at a time.
DECISION OUTPUT
Recommended action: validate first
DECISION Do not move directly to a full site slipstream pilot on the basis of the current public record. Retain the technology as a qualified option and first close the mixed-gas, durability and integration gaps through developer evidence review and a bounded validation programme.
Why this is not a rejection
The technology offers a credible mechanism, published progress on oxygen stability and a potentially attractive electrical regeneration route. Cement also provides a stronger CO₂ concentration than many combustion streams. The hold is caused by application-transfer uncertainty, not by absence of scientific merit.
Draft evidence gates for the next stage
Gate | Draft condition to demonstrate | Evidence expected |
|---|---|---|
Mixed-gas capture | Operate at the agreed CO₂ and O₂ range with controlled SO₂, NOₓ and humidity challenges | Time-series capture fraction, release purity, current, voltage and mass balance. |
Durability | Target at least 1,000 continuous hours or a justified equivalent cycle count | Capacity retention, electron utilisation, degradation chemistry and maintenance events. |
Upset recovery | Recover after defined oxygen and impurity excursions without irreversible performance loss | Pre-event, event and post-event performance with recovery time. |
System energy | Report capture, release, pumping, conditioning and compression separately | Auditable kWh/t CO₂ and thermal-duty schedule before common-basis conversion. |
Integration | Define pretreatment, tie-in, turndown, footprint, utilities, CO₂ polishing and waste streams | Preliminary process flow, equipment list and interface register. |
Scale pathway | Show a credible progression from cell to module, stack and slipstream | Manufacturing route, active area, module count, replacement plan and pilot references. |
What the client receives
- A traceable evidence register with source type, system boundary, conditions, result and confidence status.
- Technology and developer evidence cards that separate demonstrated capability from claims and extrapolations.
- The Application Transfer Window and an impurity-tolerance register.
- A common-basis benchmark against the selected capture alternatives.
- A decision brief with pursue, validate, partner, monitor or set-aside logic.
- A next-step validation specification suitable for discussion with laboratories, technology developers or engineering partners.
DELIVERY AND SOURCES
Indicative project delivery
Timing | Research activity | Primary output |
|---|---|---|
Week 1 | Decision protocol, site data request and technology boundary | Agreed evidence and comparison framework |
Weeks 2 to 3 | Scientific, patent, project, developer and regulatory evidence review | Structured evidence register and technology taxonomy |
Weeks 3 to 4 | Condition-transfer analysis and normalised benchmarking | Transfer window, impurity register and benchmark workbook |
Week 5 | Challenge review, confidence assignment and action gate | Draft decision brief and evidence-gap map |
Weeks 6 to 7, if required | Focused developer, patent-family or integration deep dive | Validation specification and partner discussion pack |
Delivery can include a PowerPoint decision readout, an Excel evidence register and benchmarking workbook, and a concise Word or PDF research report. The evidence register retains source links, dates, assumptions and exclusion reasons so the assessment can be refreshed as the field develops.
TIMELINE NOTE: The five-to-seven-week range is indicative. Actual timing depends on the number of technology architectures, geographical coverage, patent-family depth, availability of full technical records and whether developer-specific evidence is included.
Let’s discuss your project
If your team is deciding whether an emerging capture technology deserves validation, partnership, continued monitoring or removal from the active portfolio, August Research can build the assessment around your operating conditions, evidence threshold and investment horizon.
NOTE: This hypothetical engagement demonstrates the service. Industry context and technical interpretation are grounded in published sources. Plant inputs, thresholds, timeline and outputs are examples, not client results, and would be redefined for a live project.