R&D & INNOVATION / SECONDARY RESEARCH
Tactile-Sensing Grippers for Mixed-SKU Robotic Picking
Emerging Technology Assessment | robotics, warehousing and commercial equipment
DECISION QUESTION Should a warehouse-automation developer integrate tactile sensing into its next mixed-SKU picking cell, or first prove that the added sensing and control burden produces a repeatable operational advantage?
The situation
A robotic picking-system developer is preparing a new cell for a distribution environment containing rigid cartons, flexible pouches, glossy consumer packs, thin sachets and partially occluded items. Vision-guided suction performs well on many regular packages, but errors remain concentrated in products that deform, slip, present uncertain contact or sit behind other objects. The team is considering optical tactile fingers, pressure-sensitive fingertips and sensor-driven multi-suction tools.
The technology signal is real but fragmented. Recent public demonstrations report improvements in specific tasks: TetraGrip reported a 22.86% improvement over a single-suction gripper in stacked-object scenarios, PP-Tac reported an 87.5% success rate on paper-like objects, and a tactile mobile-manipulation study reported 66% success compared with 34% for a vision-only method. These results show capability under bounded test conditions. They do not establish performance across a commercial SKU mix, target cycle time, contamination level or maintenance regime.
Why the question requires an application-specific assessment
- A stronger laboratory grasp-success rate may not survive higher picks per hour, imperfect item presentation or rapid SKU change.
- Tactile sensing can improve contact-state awareness, but it adds calibration, protective-skin wear, compute, cabling, cleaning and replacement requirements.
- Evidence from thin-paper handling, dexterous hands and mobile lifting cannot be treated as direct proof for high-throughput bin picking.
- The decision depends on where tactile feedback adds value relative to better vision, compliant suction, proximity sensing or improved item presentation.
WORKING PREMISE The assessment does not ask whether tactile sensing works. It asks which sensing architecture is transferable to the client’s SKU and duty-cycle envelope, and whether the benefit is large enough to justify integration and validation.
ENGAGEMENT DEFINITION
A working operating envelope
A common SKU and operating envelope is defined before public demonstrations are compared. The values below are hypothetical project inputs and would be replaced with the client’s item master, exception logs, cycle-time data and cell architecture.
Parameter | Working project input | Assessment significance |
|---|---|---|
SKU population | Approximately 2,500 active SKUs; 200 priority items represent most manual exceptions | Keeps the research focused on the failure tail, not average cartons. |
Item mass | 20 g to 6 kg | Affects end-effector choice, grip force, payload and motion profile. |
Package forms | Cartons, bottles, pouches, trays, sachets and shrink-wrapped multipacks | Creates different contact, porosity, reflectivity and deformation modes. |
Throughput intent | Target 500 to 650 attempted picks per hour at cell level | Prevents slow laboratory manipulation from being treated as operationally equivalent. |
Quality threshold | At least 98.5% damage-free placement for the priority set | Connects sensing performance with sellable-item quality. |
Environment | Ambient warehouse; dust, label debris and periodic cleaning | Tests whether sensor surfaces and calibration remain stable. |
Decision horizon | Architecture freeze within nine months | Defines how much new evidence can reasonably be generated before design lock. |
Technology boundary
The assessment covers vision-based tactile fingertips, force and torque sensing, pressure arrays, slip detection, compliant fingers, proximity-assisted suction and hybrid vision-tactile control. General-purpose humanoid hands are included only where their evidence reveals a transferable sensing or control mechanism. They are not treated as procurement-ready substitutes for the target cell.
COMPARISON RULE Every result is tagged by item type, presentation, grasp tool, sensing mode, success definition, cycle time, training requirement and test repetitions. A success percentage without these conditions is not used as a standalone readiness indicator.
HOW THE RESEARCH IS EXECUTED
A failure-led assessment
1. BUILD THE EXCEPTION TAXONOMY Classify current misses as detection error, approach error, seal failure, slip, deformation, double pick, damage, placement loss or recovery failure.
2. MAP SENSING TO FAILURE MECHANISM Determine whether each technology can observe the decision variable that causes the error, such as contact patch, shear, pressure, proximity or seal quality.
3. RECONSTRUCT DEMONSTRATIONS Extract object set, clutter, occlusion, sensor construction, controller, success definition, repetitions, throughput and failure cases.
4. TEST TRANSFERABILITY Compare published conditions with the priority SKU set, end-effector envelope, robot payload, cleaning regime, latency and changeover expectations.
5. ASSESS INTEGRATION BURDEN Map compute, calibration, retraining, skins, cabling, spares, safety, software interfaces and maintenance ownership.
6. BUILD A WEIGHTED CHALLENGE SET Translate the evidence gaps into a small validation library that overrepresents the failure tail instead of sampling only easy products.
7. SET AN ACTION GATE Recommend integrate, validate first, partner, monitor or set aside, with measurable evidence required for the next gate.
Evidence fields retained
Field | What is recorded | Why it changes interpretation |
|---|---|---|
Success event | Lift only, transfer, placement, damage-free placement or full order action | Avoids comparing partial and complete tasks. |
Object novelty | Seen, held-out variant or entirely unseen item family | Shows whether performance depends on training familiarity. |
Operational rate | Planning latency, grasp time, recovery time and attempted picks per hour | Separates accuracy from useful throughput. |
Reliability burden | Calibration frequency, skin life, fouling, drift and replacement method | Exposes hidden availability and maintenance costs. |
EVIDENCE INTERPRETATION AND VISUAL OUTPUT
Promising capability, uneven operational proof
The strongest recent signals support the value of richer contact feedback for selected failure modes. Sensor-driven suction can improve access to stacked or obstructed items, while tactile fingertips can detect slip and regulate force on thin or deformable objects. Yet the public evidence is distributed across different robot forms, object sets and success definitions. It does not provide a common-basis answer for a 2,500-SKU commercial cell.
The assessment would therefore avoid a single accuracy ranking. It would identify the failure classes where contact information is decision-critical, the classes where vision or compliant suction is probably sufficient, and the items that need a short application-specific trial.
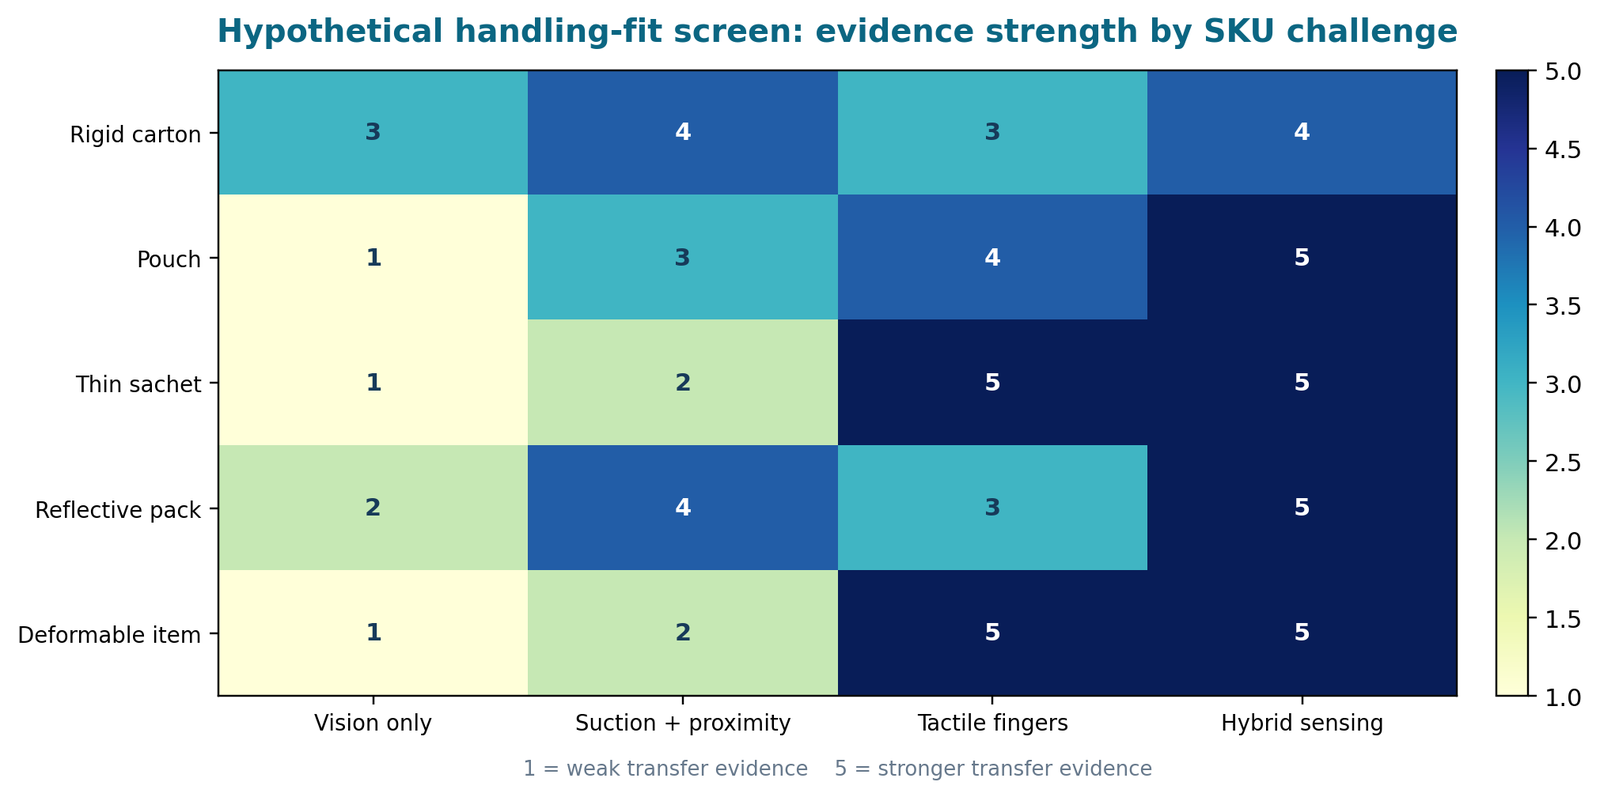
What this output makes visible
- Tactile fingers appear most relevant where deformation, slip or thin-item state cannot be inferred reliably from vision alone.
- Hybrid sensing may offer the widest coverage, but it also creates the largest software, calibration and maintenance burden.
- The commercial decision should be based on improvement within the client’s costly exception set, not performance on an undifferentiated object benchmark.
WEBSITE PRESENTATION SUGGESTION Use an interactive SKU Challenge Wall. Visitors select an item type or failure mode and see which sensing architectures provide direct, adjacent or missing evidence. A second layer reveals cycle time, test repetitions and maintenance assumptions. On mobile, show one challenge card at a time with a swipeable comparison strip.
DECISION OUTPUT
Recommended action: validate a hybrid architecture on the failure tail
DECISION Do not commit the full product architecture to tactile sensing on public success rates alone. Shortlist one tactile-finger route and one proximity-assisted suction route, then compare both against the existing vision baseline on a weighted exception set.
Draft evidence gates
Gate | Draft condition | Evidence expected |
|---|---|---|
Coverage | At least 180 priority SKUs across the defined failure classes | Item-level success, damage, double-pick and recovery records. |
Throughput | Meet the agreed cell-rate window including recovery actions | Attempted picks per hour, latency distribution and intervention time. |
Durability | Complete at least 250,000 grasp cycles or justified accelerated equivalent | Drift, calibration, skin wear, cleaning and component replacement log. |
Novelty | Test held-out products and packaging variants | Performance split for known, variant and unseen items. |
Integration | Demonstrate safe robot, PLC and warehouse-software interfaces | Interface map, fault states, fallback logic and service procedure. |
Value | Show a material reduction in costly manual exceptions | Labour touches avoided, damage avoided, availability and consumables model. |
What the client receives
- A failure taxonomy linked to sensing mechanisms and published evidence.
- Technology cards covering sensor architecture, control approach, demonstrated object set and limitations.
- The SKU Challenge Wall and a common-basis performance workbook.
- An integration and maintenance dependency register.
- A weighted validation set and acceptance protocol for the shortlisted architectures.
- A decision brief with action lane, confidence status and monitoring triggers.
DELIVERY AND NEXT STEP
Indicative project delivery
Timing | Research activity | Primary output |
|---|---|---|
Week 1 | Decision protocol, exception data request and SKU segmentation | Failure taxonomy and working test envelope |
Weeks 2 to 3 | Scientific, patent, developer and deployment evidence review | Technology cards and demonstration register |
Week 4 | Transfer assessment and integration-burden analysis | Handling-fit screen and dependency register |
Week 5 | Challenge review and validation design | Shortlist, action gate and validation specification |
Week 6, if required | Focused developer or component deep dive | Partner discussion pack and refreshed decision brief |
Delivery can include a PowerPoint decision readout, an Excel SKU-to-evidence matrix, a Word or PDF assessment and a validation protocol that can be shared with a robotics integrator or external test facility.
TIMELINE NOTE: The stated timeline is indicative. Actual timing depends on the number of technology variants, geographical coverage, availability of full technical records, source-language requirements and the depth of developer or patent analysis.
Let’s discuss your project
If your team is deciding whether tactile sensing belongs in a product roadmap or a warehouse cell, August Research can test the technology against your actual exception pattern, operating rate and integration constraints.
NOTE: This hypothetical engagement demonstrates the service. Public technical results inform the interpretation, while SKU counts, thresholds, timeline, scoring and recommendations are examples rather than client outcomes.