R&D & INNOVATION / SECONDARY RESEARCH
Hyperspectral Ore Sorting for Low-Grade Copper Feed
Emerging Technology Assessment | mining, raw materials and mineral processing
DECISION QUESTION Is hyperspectral sorting sufficiently transferable to justify a site pilot on low-grade copper ore, or should the operation first establish intrinsic sortability and compare sensor routes?
The situation
A copper operation is considering particle sorting ahead of grinding and flotation to reject barren material, reduce energy and water intensity, and preserve concentrator capacity as ore grade declines. Hyperspectral imaging is attractive because it can identify surface mineralogical signatures without destructive sampling. The risk is that surface response may not represent internal copper distribution, while dust, moisture, particle overlap, mineral texture and changing ore domains can weaken classification.
Recent evidence shows why a disciplined assessment is needed. A hyperspectral deep-learning study reported 91.9% classification accuracy across five mineral types, demonstrating strong mineral-recognition potential under controlled conditions. A 2026 low-grade copper study using dual-energy XRT increased feed from 0.50% to 0.91% Cu while retaining 95.67% of copper and rejecting 47.92% of mass. That XRT result is not proof for hyperspectral sorting, but it provides a useful site-decision comparator and shows the value of measuring recovery and waste rejection together.
Why the question requires an application-specific assessment
- A high mineral-classification accuracy does not automatically translate to copper recovery or waste rejection.
- Hyperspectral sensing is surface-sensitive; internal mineral distribution and liberation may require XRT, XRF or sensor fusion.
- Particle size, moisture, belt loading and overlap can alter spectra and classification stability.
- The value case depends on downstream grinding, flotation recovery, water use and ore-domain variability, not sorting performance alone.
WORKING PREMISE The assessment begins with intrinsic sortability and the site duty. Hyperspectral imaging is evaluated against competing and complementary sensors, rather than assumed to be the preferred route.
ENGAGEMENT DEFINITION
A site-relevant sorting duty
A hypothetical feed envelope is used to determine which demonstrations are transferable and which test work is required before a pilot decision.
Parameter | Working project input | Assessment significance |
|---|---|---|
Feed grade | 0.35 to 0.65% total Cu across three ore domains | Requires separation value at low grade and under variability. |
Particle range | 25 to 100 mm after primary crushing | Controls presentation, liberation and sensor resolution. |
Throughput intent | 250 t/h module | Tests whether scan, classification and ejection can operate at scale. |
Mineralogy | Chalcopyrite-dominant with variable pyrite, quartz and alteration minerals | Determines whether surface signatures correlate with copper. |
Moisture and dust | 0.5 to 5% surface moisture with seasonal dust variation | Can shift spectra and affect belt visibility. |
Performance intent | Reject at least 35% mass while retaining at least 88% Cu | Creates a grade-recovery gate without assuming feasibility. |
Downstream constraint | Do not materially reduce flotation recovery or concentrate quality | Links pre-concentration with the full value chain. |
Technology boundary
The assessment covers visible and near-infrared hyperspectral imaging, short-wave infrared sensing, laser and colour imaging, XRT, XRF and sensor-fusion concepts. Core scanning is included only where it improves geometallurgical understanding; it is not treated as an online particle-sorting substitute.
COMPARISON RULE Classification accuracy, copper recovery, grade uplift and waste rejection are retained as different measures. Results are compared only after particle size, mineralogy, moisture, belt loading, sampling design and validation split are recorded.
HOW THE RESEARCH IS EXECUTED
From ore domain to sensor decision
1. DEFINE THE SORTING DUTY Locate the proposed diversion point, particle-size band, capacity constraint, value objective and downstream acceptance limits.
2. ESTABLISH INTRINSIC SORTABILITY Review mineral association, texture, liberation, grade heterogeneity and representative-sampling requirements before selecting a sensor.
3. MAP DETECTABLE PROXIES Determine whether spectral, density, elemental, colour or thermal properties correlate with copper-bearing particles in each ore domain.
4. RECONSTRUCT TEST EVIDENCE Extract sample mass, particle count, domain coverage, sensor geometry, spectral preprocessing, train-test separation, recovery, rejection and error distribution.
5. CHALLENGE FIELD TRANSFER Assess dust, moisture, belt occupancy, particle overlap, calibration drift, illumination, ejector timing and maintenance.
6. MODEL DOWNSTREAM CONSEQUENCES Translate accept and reject streams into grinding load, energy, water, flotation recovery, metal loss and stockpile strategy.
7. SET THE TEST-WORK GATE Recommend bench characterisation, bulk trial, pilot, sensor-fusion study, monitoring or set-aside with measurable conditions.
Evidence extraction fields
Field | What is recorded | Error prevented |
|---|---|---|
Sample design | Domain, location, mass, particle count and representativeness | Treating a convenient sample as the orebody. |
Validation design | Random split, particle-level separation, held-out domain and external test set | Allowing data leakage to inflate model accuracy. |
Sorting result | Mass pull, grade, recovery, rejection, false rejects and uncertainty | Using classification accuracy as a process result. |
Field condition | Moisture, dust, overlap, speed, illumination and calibration routine | Ignoring the difference between static scanning and production sorting. |
EVIDENCE INTERPRETATION AND VISUAL OUTPUT
Sensor potential is plausible; site transfer remains conditional
Hyperspectral imaging can distinguish mineralogical signatures and has demonstrated high classification accuracy in controlled mineral datasets. Its site value depends on whether the signature is present on the exposed particle surface and remains stable across ore domains, moisture and presentation conditions. A model trained on spectra from one domain may fail when alteration or gangue composition changes.
The XRT comparator provides a useful reminder that the business question is a grade-recovery trade-off. Its reported 95.67% copper recovery and 47.92% mass rejection were achieved on a particular low-grade sample and laboratory sorter. The result supports the potential of sensor-based pre-concentration, but not direct transfer to the target mine or a hyperspectral route.
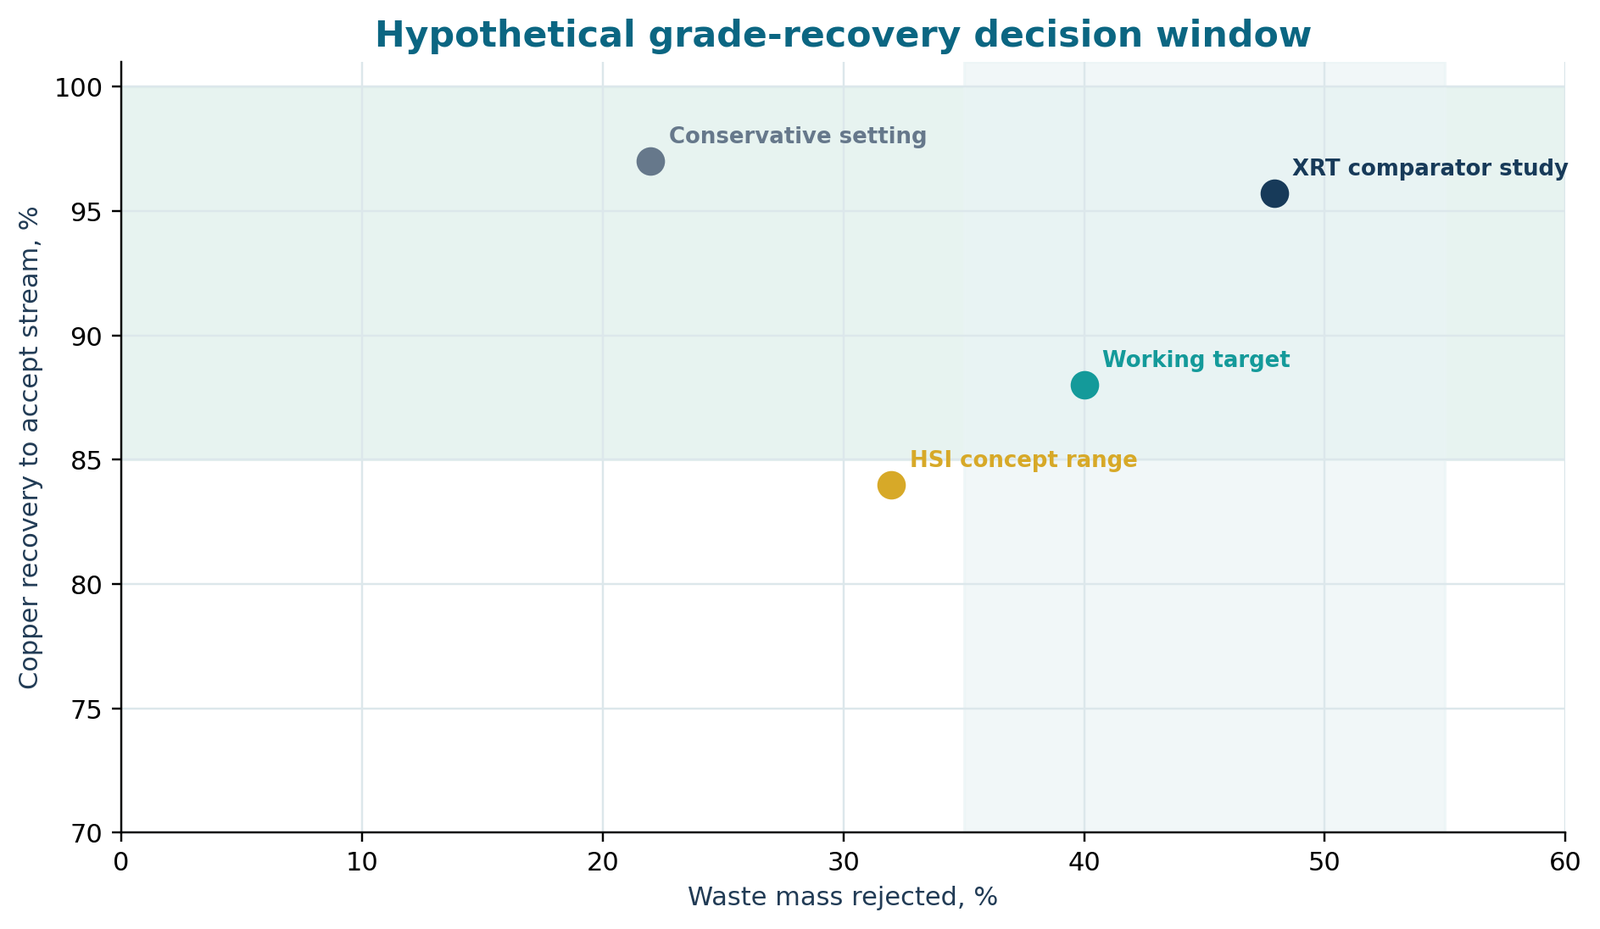
What the visual changes
- An option can reject more mass yet destroy value if copper loss exceeds the site threshold.
- A classifier score must be translated into physical accept and reject streams before it informs a pilot decision.
- Hyperspectral, XRT and sensor-fusion routes can be compared against the same operating window without assuming identical mechanisms.
WEBSITE PRESENTATION SUGGESTION Use an interactive Ore Decision Lens. Visitors move a recovery slider and see the corresponding waste-rejection zone, downstream tonnage and unresolved evidence. Selecting an ore domain reveals sensor coverage and sample quality. On mobile, show the trade-off plot above an expandable domain card.
DECISION OUTPUT
Recommended action: establish intrinsic sortability before a site pilot
DECISION Do not select hyperspectral imaging as the sole sensor at this stage. Begin with representative domain characterisation and a comparative bench programme covering hyperspectral, XRT and a sensor-fusion option. Advance only if the grade-recovery window is met across domains.
Draft evidence gates
Gate | Draft condition | Evidence expected |
|---|---|---|
Representativeness | Composite samples from at least three ore domains and seasonal conditions | Sampling rationale, mass, size distribution and mineralogical characterisation. |
Intrinsic sortability | Demonstrate particle-scale grade heterogeneity and a detectable proxy | Particle assays linked to spectral, density or elemental response. |
Sorting performance | At least 88% Cu recovery with at least 35% mass rejection | Replicated mass balance with uncertainty and false-reject analysis. |
Robustness | Retain performance under moisture, dust and belt-loading challenges | Challenge-test results and recalibration requirements. |
Downstream value | No material loss in flotation recovery or concentrate quality | Grinding, flotation and water-balance test work on accept stream. |
Scale pathway | Credible 250 t/h equipment, ejection and maintenance concept | Vendor configuration, footprint, utilities, availability and service assumptions. |
What the client receives
- An ore-domain and sorting-duty definition.
- A sensor-to-mineral-property matrix and demonstration register.
- A common-basis grade, recovery and waste-rejection workbook.
- The Ore Decision Lens and a transfer-risk map.
- A representative sampling and comparative test-work specification.
- A pilot action gate with downstream-value and scale requirements.
DELIVERY AND NEXT STEP
Indicative project delivery
Timing | Research activity | Primary output |
|---|---|---|
Week 1 | Sorting duty, site-data request and ore-domain framing | Working decision and evidence protocol |
Weeks 2 to 3 | Technical, patent, project and vendor evidence review | Sensor taxonomy and demonstration register |
Week 4 | Transferability and grade-recovery comparison | Decision lens and benchmark workbook |
Week 5 | Downstream-value and deployment dependency analysis | Risk map and test-work options |
Week 6 | Challenge review and pilot gate design | Decision brief and comparative test specification |
Delivery can include a PowerPoint decision readout, an Excel grade-recovery workbook, a Word or PDF technical report, and a sampling and test-work specification suitable for discussion with mineral laboratories and sorting-equipment providers.
TIMELINE NOTE: The stated timeline is indicative. Actual timing depends on the number of technology variants, geographical coverage, availability of full technical records, source-language requirements and the depth of developer or patent analysis.
Let’s discuss your project
If your team is evaluating sensor-based pre-concentration, August Research can determine which evidence transfers to your ore domains and what must be tested before a pilot commitment.
NOTE: This hypothetical engagement demonstrates the service. Public technical evidence informs the interpretation, while site grades, throughput, thresholds, timeline and recommendations are examples rather than client results.