INDUSTRY ANALYSIS | CIRCULAR TEXTILES
Who Should Carry Feedstock Risk in a
Southern European Textile Recycling Corridor?
How a materials company could decide whether to remain a recycler, secure long-term feedstock contracts or integrate into sorting and preprocessing.
3
COUNTRY SYSTEMS
2025-2030
DECISION HORIZON
7
INDUSTRY ROLES
3
STRATEGIC POSITIONS
The business situation
A materials company evaluating recycled textile feedstock in Europe faced a structural problem. Policy could increase separately collected volumes, yet collection alone would not guarantee recyclable composition, low contamination, consistent bales or predictable delivery. The company needed to understand where feedstock quality is created, where it is lost and which participant should carry each commercial risk.
DECISION QUESTION Which position in the feedstock system would give the company sufficient control over quality and supply without absorbing risks it cannot manage?
Three positions under consideration
Recycler only: Purchase specification-compliant feedstock and retain a narrow operating role.
Contracted supply: Use multi-year contracts with sorters and preprocessors to transfer defined quality and volume obligations.
Integrated preprocessing: Control sorting specifications and preparation before material enters the recycling process.
COMMERCIAL TENSION More integration can improve control, but it also increases capital exposure, operating complexity and responsibility for material that fails the recycling specification.
WHY THE QUESTION MATTERS
More collection does not automatically create more usable feedstock
Europe's policy direction is increasing the amount of used textiles entering managed collection and sorting systems. The commercial constraint sits further downstream: collected material must still be classified, sorted, identified, prepared and matched to a recycling process with defined input tolerances.
POLICY AND SYSTEM MARKERS
2025: Separate collection systems became mandatory across EU Member States.
October 2025: The revised EU waste framework entered into force with common textile-waste rules and producer responsibility requirements.
Sorting before shipment: Separately collected textiles require sorting before they can be treated as reusable goods for shipment.
2026 onward: Implementation moves into national systems, fees, contracts, reporting and enforcement.
The structural bottleneck
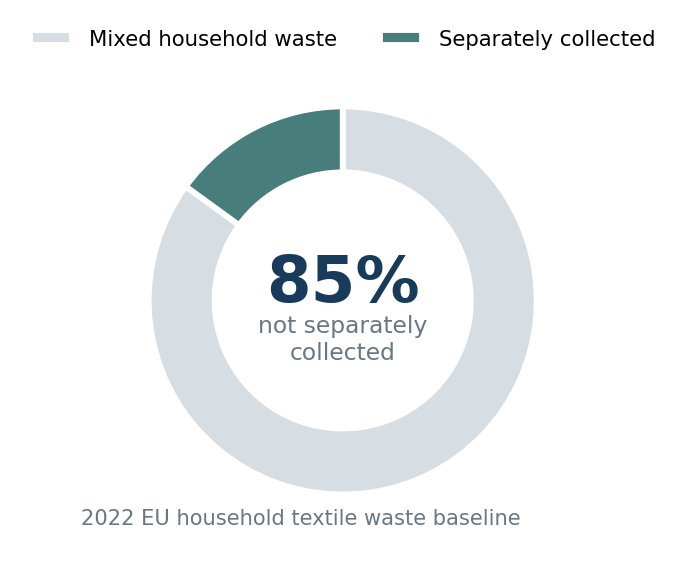
The 2022 EU baseline shows that most household textile waste still entered mixed waste rather than a separate collection route. Policy can shift this first gate. It does not by itself determine how much material is suitable for reuse, mechanical recycling or chemical recycling, or whether a recycler can obtain stable batches at an acceptable delivered cost.
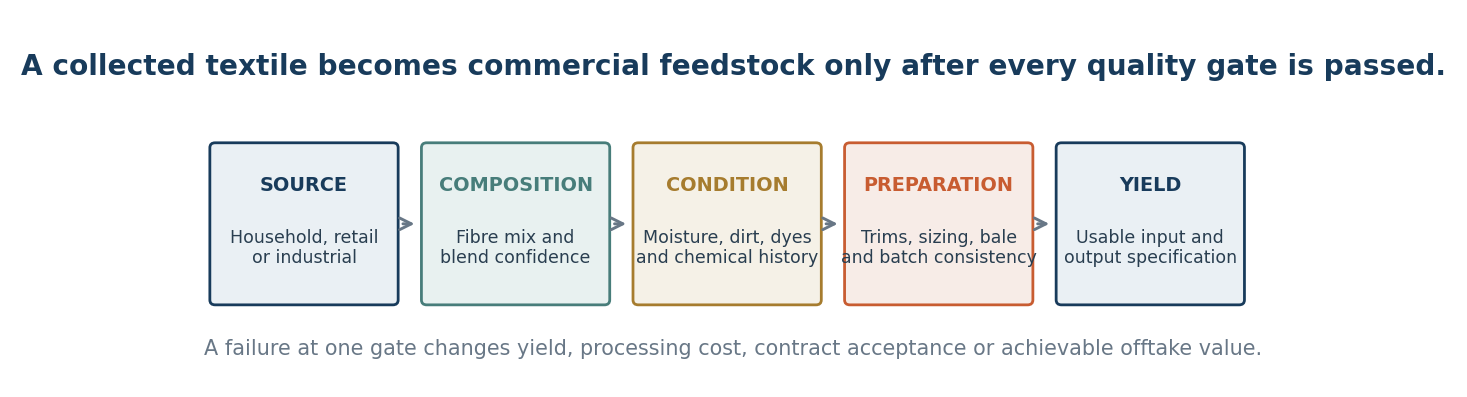
INDUSTRY IMPLICATION The scarce commercial resource is not discarded textile volume. It is consistent, traceable and process-compatible feedstock delivered under a workable allocation of risk.
SYSTEM SCOPE
A corridor defined by risk handoffs
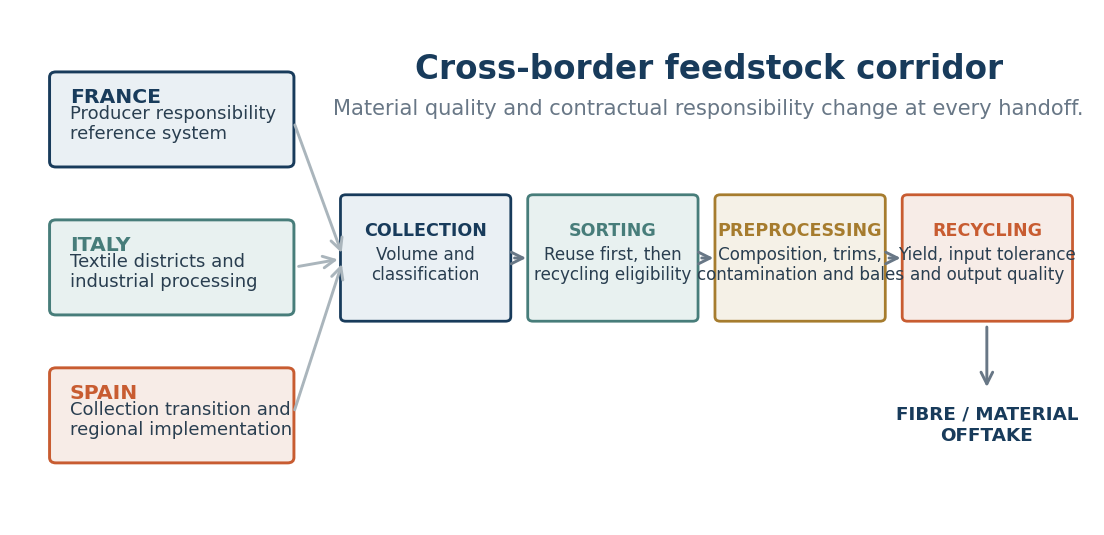
The study would compare three country systems while following the same material specification from collection to fibre or material offtake. The geography is useful because regulatory maturity, textile-industry structure and operating routes differ, while cross-border movement can connect collection, sorting, preprocessing and recycling assets.
Country parameters
COUNTRY | ROLE IN THE COMPARISON | PARAMETERS FOLLOWED |
|---|---|---|
France | Producer responsibility reference system | Fee structure, collection channels, sorting support and traceability |
Italy | Textile districts and processing capability | Industrial waste streams, cluster economics, logistics and preprocessing |
Spain | Collection and producer-responsibility transition | Regional implementation, contracting structure and volume development |
Industry roles included
Producers and brands; producer-responsibility organisations; municipalities and collection operators; reuse organisations; sorters; preprocessing companies; mechanical and chemical recyclers; logistics providers; fibre and material buyers.
BOUNDARY CONTROL Reusable garments, recycling feedstock and residual waste remain separate flows. Moving material between them without a defined classification would distort both volume and economics.
METHODOLOGY
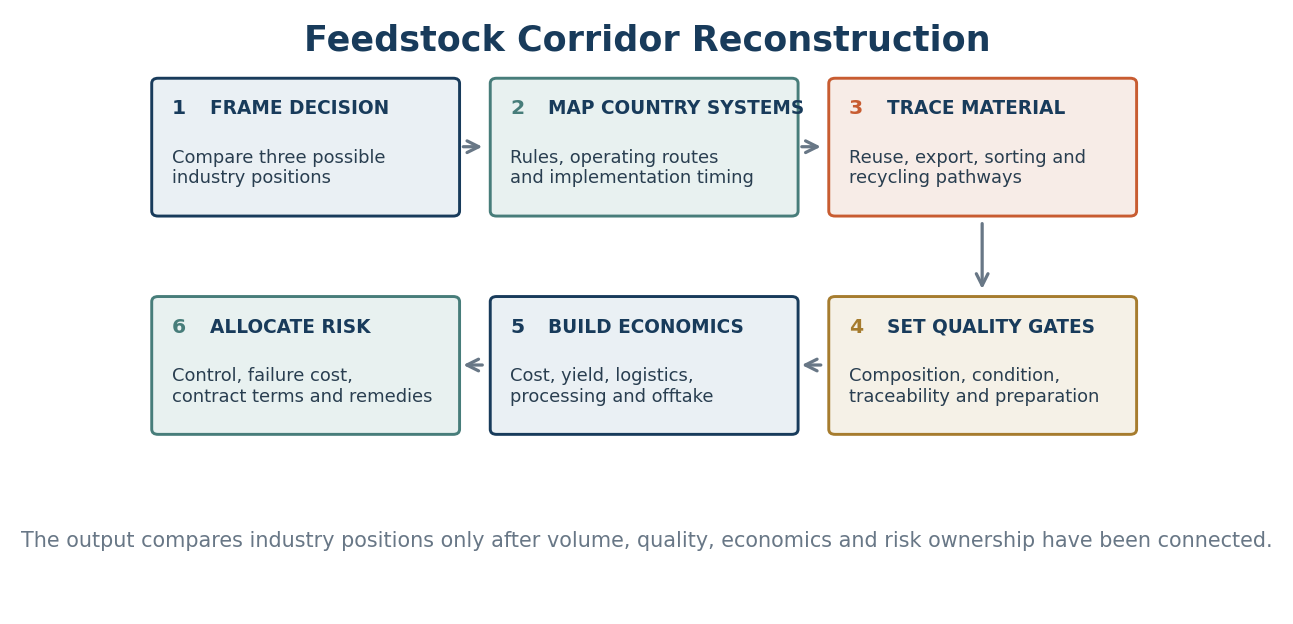
Feedstock Corridor Reconstruction
This method is designed around a cross-border material and risk question. It follows one specification through several industry roles, then tests which strategic position can control the variables that matter most.
Evidence assembled for each handoff
EVIDENCE LAYER | WHAT IS RECONSTRUCTED |
|---|---|
Regulation and responsibility | EU and national rules, producer obligations, schemes, fees, implementation dates and reporting |
Material flow | Waste generation, collection routes, reuse, export, sorting, residuals and recycling pathways |
Quality and process | Fibre composition, contamination, identification, preprocessing, input tolerance, yield and output grade |
Economics | Collection and sorting cost, yield loss, preparation, logistics, processing, disposal and offtake value |
Commercial structure | Contracts, ownership, quality claims, rejection rights, minimum volumes, price adjustment and risk remedies |
METHOD CONTROL A published tonnage enters the model only after its material definition, geography, year and pathway are known. Discarded textiles, collected textiles and recycling-compatible feedstock are not interchangeable.
COMMERCIAL ANALYSIS
Risk ownership determines the value of integration
Each strategic position changes what the company can control and what remains dependent on suppliers, local collection systems and offtake conditions. The analysis therefore compares residual risk, not only gross margin or available volume.
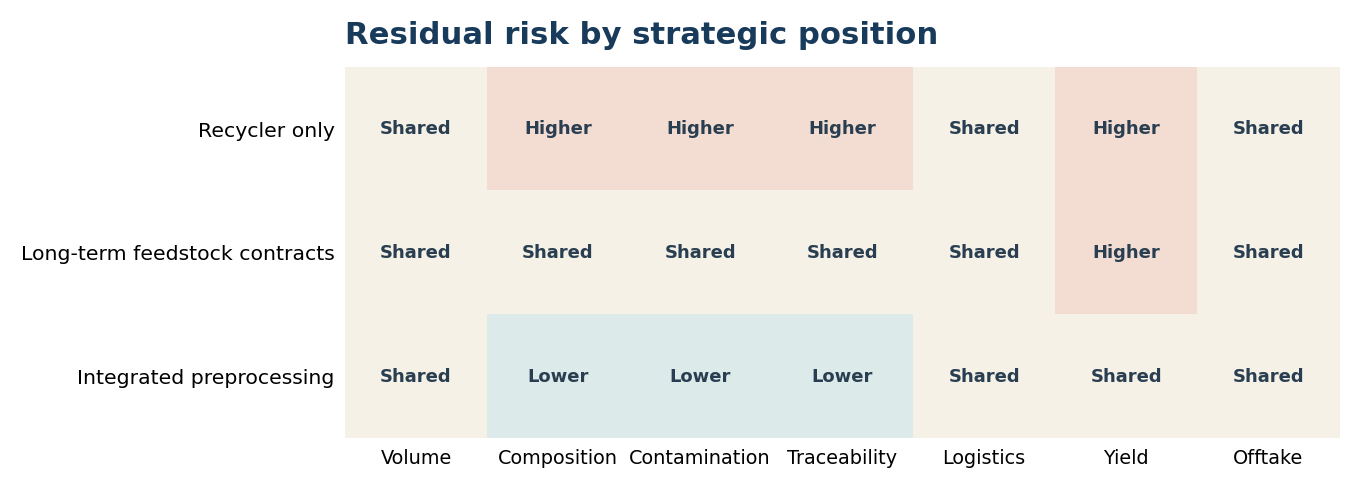
How the heatmap would be built
Control test: Can the company directly change the variable, specify it contractually or only observe it?
Failure test: Who carries the cost when volume, quality, timing or yield falls outside the agreed range?
Evidence test: Is the risk position supported by operating evidence, a contract term or only an assumption?
Concentration test: Would integration reduce dependence on one counterparty while increasing exposure to one region or technology?
Likely decision tensions
- A recycler-only position protects capital but leaves quality and availability largely outside direct control.
- Long-term contracts can transfer obligations only when specifications, testing, rejection and remedies are enforceable.
- Integrated preprocessing can improve composition and traceability control, but it also creates exposure to low-value residual material.
- Cross-border supply can diversify volume while increasing logistics, classification and documentation complexity.
INTERPRETATION The heatmap is an example of the decision framework. Final ratings would depend on the selected process, feedstock specification, country routes and counterparties.
DECISION OUTPUT
Choose a position through conditions, not a universal ranking
The analysis would not declare vertical integration inherently superior. It would define the conditions under which each position is commercially coherent and identify the indicators that should trigger a change in strategy.
STRATEGIC POSITION | WHEN IT BECOMES CREDIBLE | DECISION EVIDENCE REQUIRED |
|---|---|---|
Recycler only | Reliable specification-compliant supply already exists | Supplier qualification, batch testing, price formula and rejection rights |
Contracted supply | Several capable partners can accept measurable obligations | Volume bands, composition tolerance, contamination limits, traceability and remedies |
Integrated preprocessing | Feedstock control is strategically valuable and residual outlets are viable | Hub utilization, sorting yield, residual value, capital requirement and operating capability |
Recommended decision sequence
First: Confirm the recycling process specification and the economic cost of variation.
Second: Identify which country and industry handoffs create the largest uncontrollable quality loss.
Third: Test whether contracts can transfer those risks at a viable price and enforcement level.
Fourth: Evaluate integration only for the controls that cannot be secured reliably through the market.
What the client receives
Country-system comparison; feedstock corridor map; material and quality-gate model; cost and value-flow reconstruction; risk-ownership matrix; strategic position comparison; contract evidence checklist; decision triggers and monitoring dashboard.
NOTE This example demonstrates a possible Industry Analysis engagement. It does not present client results, supplier recommendations or an investment conclusion.
Contact Us
Discuss the industry structure, geography and strategic position you need to understand. August Research can reconstruct the system, follow the material and economic flows, and show where control and risk should sit.
August Research | Market & Business Intelligence