INDUSTRY ANALYSIS | CONSTRUCTION EQUIPMENT RENTAL
Who Will Capture Value as GCC Projects Shift Equipment from Ownership to Rental?
How an equipment manufacturer could choose between dealer-led rental, a captive fleet or a hybrid model in Saudi Arabia and the UAE.
2
COUNTRY SYSTEMS
5
FLEET CLASSES
30 months
DEMAND WINDOW
3
OPERATING MODELS
The business situation
A construction equipment manufacturer saw growing demand for flexible fleet access around large and uneven project pipelines. Selling more units into rental channels could increase installed base, but the manufacturer did not know who would control pricing, allocation, service data, utilization and residual value once the equipment entered a fleet.
DECISION QUESTION Which operating model would give the manufacturer enough control over fleet performance and customer access without creating unacceptable asset and credit exposure?
Models under consideration
Dealer-led rental: Support selected dealers that own, price and deploy the fleet.
Captive rental: Own the fleet and control allocation, service standards, telematics and customer contracts.
Hybrid model: Retain selected fleet and data rights while dealers manage local deployment.
COMMERCIAL TENSION Rental can improve customer flexibility and recurring contact, but idle equipment, delayed payment and weak remarketing discipline can erase the value created during billable use.
INDUSTRY MECHANICS
The unit of analysis is a fleet day, not an equipment sale
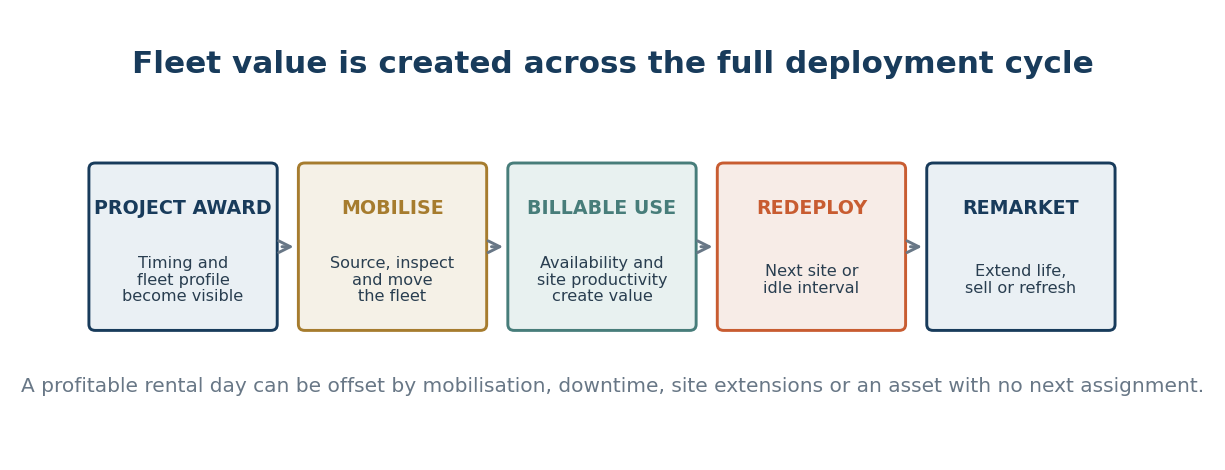
Project demand does not become rental value until an asset is available in the right location, mobilised on time, productive on site and redeployed without a long idle interval. The analysis therefore follows each fleet class through the complete project cycle.
Parameters followed
MECHANIC | WHAT IS RECONSTRUCTED |
|---|---|
Demand | Project awards, start dates, work packages, equipment intensity and duration |
Fleet | Age, availability, location, specification, telematics and next assignment |
Commercial | Rate structure, minimum period, extension, damage, fuel and payment terms |
Operating | Mobilisation, service response, parts, operator support and demobilisation |
End of cycle | Redeployment probability, idle interval, refurbishment and residual-value route |
WHY GEOGRAPHY MATTERS Saudi Arabia and the UAE are compared because project timing, customer concentration, dealer coverage and cross-border fleet movement create different utilization conditions.
METHODOLOGY
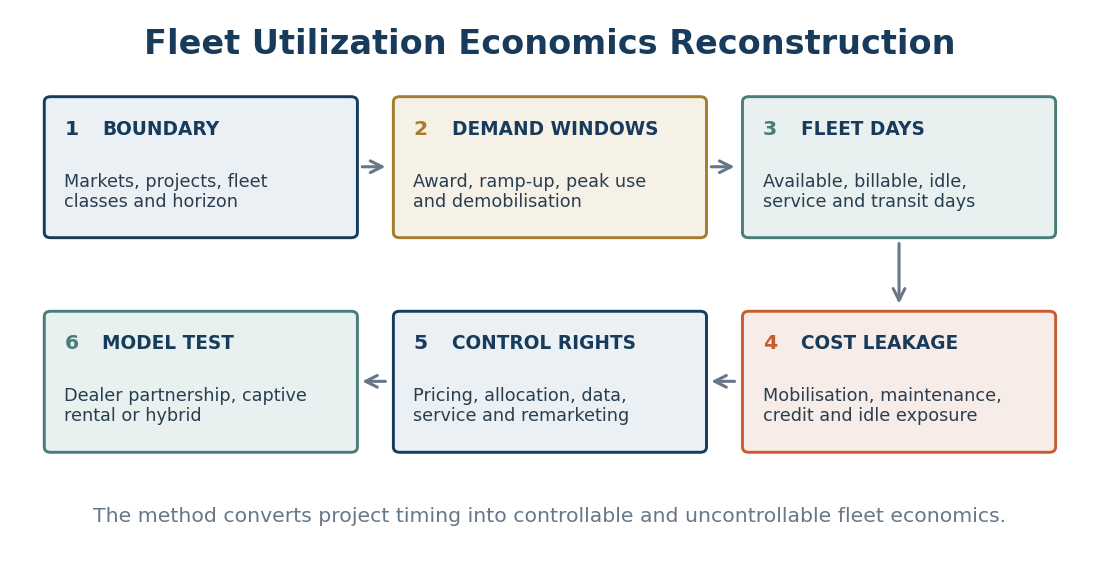
Fleet Utilization Economics Reconstruction
This method links project timing to fleet-day economics and then tests who can control each source of value leakage. It avoids assuming that a growing project pipeline automatically produces a profitable rental fleet.
Evidence architecture
EVIDENCE LAYER | PURPOSE |
|---|---|
Project signals | Award status, package timing, contractor mobilisation and schedule movement |
Fleet signals | Dealer inventory, rental listings, fleet age, telematics capability and service footprint |
Transaction rules | Rental terms, insurance, damage, transport, extension and payment conditions |
Operating economics | Billable days, downtime, transit, maintenance, idle time and remarketing |
Control rights | Who sets price, sees utilization, allocates assets, owns the customer and carries loss |
METHOD CONTROL A project enters the demand model only after its status, work package, timing and equipment requirement are separated from headline project value.
OPERATING-MODEL ANALYSIS
Utilization is necessary, but control determines who benefits
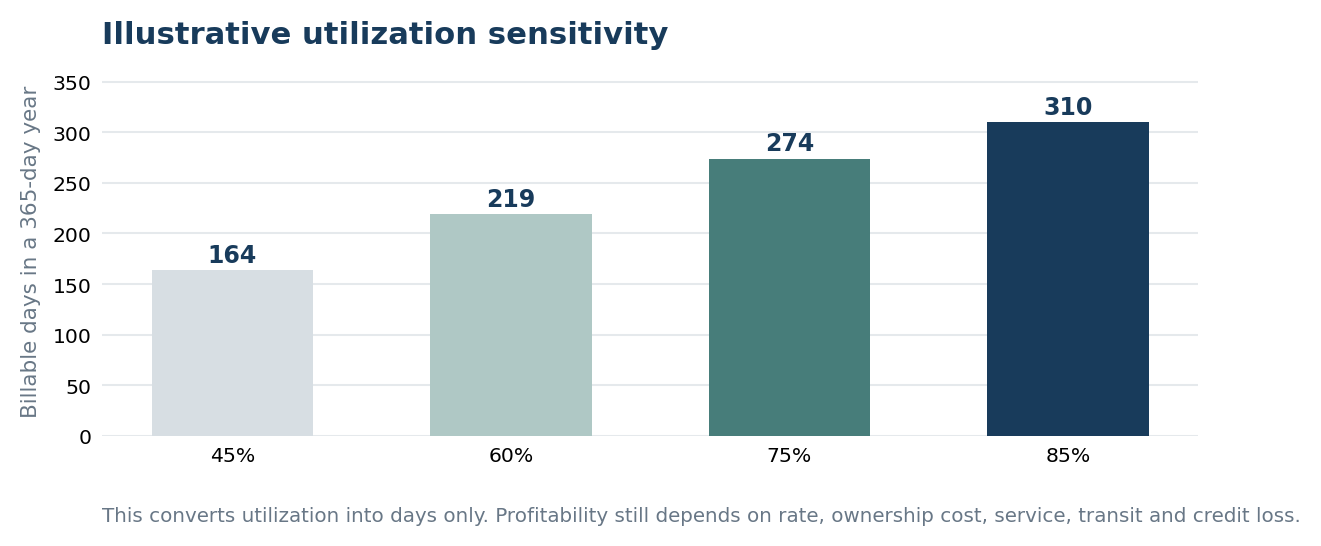
The sensitivity view converts utilization into billable days without pretending to know the client's rates or cost base. Those confidential inputs would be added later to identify the actual economic threshold for each fleet class.
Control matrix
CONTROL AREA | DEALER-LED | CAPTIVE | HYBRID |
|---|---|---|---|
Fleet allocation | Dealer | Manufacturer | Shared rules |
Pricing and discount | Dealer | Manufacturer | Guardrails |
Telematics and use data | Negotiated | Manufacturer | Shared feed |
Maintenance standard | Dealer | Manufacturer | Certified dealer |
Idle and residual-value risk | Dealer | Manufacturer | Allocated by pool |
INTERPRETATION The preferred model can differ by fleet class. High-service or data-rich assets may justify more control, while commoditised equipment may remain dealer-led.
DECISION OUTPUT
Choose the model by fleet class and demand window
The output would identify where the manufacturer should own assets, where it should shape dealer behaviour through contractual rights and where it should remain an equipment supplier.
MODEL | WHEN IT BECOMES CREDIBLE | DECISION IMPLICATION |
|---|---|---|
Dealer-led | Strong local fleet operator with transparent utilization and service data | Selective dealer agreements and performance standards |
Captive | Dense demand, differentiated service value and credible redeployment routes | Fleet investment, local operations and direct risk controls |
Hybrid | Control matters, but local deployment and collections remain partner strengths | Shared fleet pool, data rights and defined risk allocation |
Recommended decision sequence
First: Convert qualified project packages into equipment-specific demand windows.
Second: Model billable, service, transit and idle days for each fleet class.
Third: Identify which party can control the largest sources of leakage.
Fourth: Select ownership and contract rights by fleet class rather than using one GCC-wide model.
What the client receives
Qualified project-demand calendar; fleet-day economics model; utilization sensitivity; dealer and service-footprint map; operating-model control matrix; fleet-class recommendations; contract principles; decision triggers and monitoring indicators.
NOTE This example demonstrates a possible Industry Analysis engagement. It does not present client results, dealer recommendations or an investment conclusion.
Contact Us
Discuss the fleet classes, project pipeline and operating rights you need to understand. August Research can connect demand timing, fleet economics and channel control into a practical operating-model decision.
August Research | Market & Business Intelligence