INDUSTRY ANALYSIS | OFFSHORE WIND OPERATIONS
Who Will Control Service Capacity as the North Sea Fleet Ages?
How an industrial-services company could choose where to participate in scheduled maintenance, major-component work and offshore logistics.
4
NORTH SEA MARKETS
3
FLEET COHORTS
6
SERVICE PACKAGES
2026-2032
PLANNING HORIZON
The business situation
An industrial-services company saw a growing installed base, older operating assets and continued pressure on offshore wind economics. It needed to identify which service bottlenecks would create durable value and which opportunities depended on scarce vessels, OEM access or weather conditions outside its control.
DECISION QUESTION Should the company build direct service capacity, form vessel and component partnerships, reserve specialist capability or remain a selective subcontractor?
Service positions under consideration
Planned maintenance: Repeatable work packages around inspections, routine maintenance and campaign delivery.
Major-component response: High-consequence interventions requiring parts, lifting capability and precise coordination.
Integrated logistics: Vessel, port, technician, parts and schedule orchestration across several work types.
COMMERCIAL TENSION Scarcity can support attractive pricing, but capacity held without a matched workload can become expensive. Capacity secured too late may not protect turbine availability.
FLEET MECHANICS
Service demand changes with fleet age and contract structure
The study would separate early-life assets under warranty, stable operating fleets and ageing cohorts approaching major-component work, contract expiry, life extension or repowering. Each cohort creates a different accessible service market.
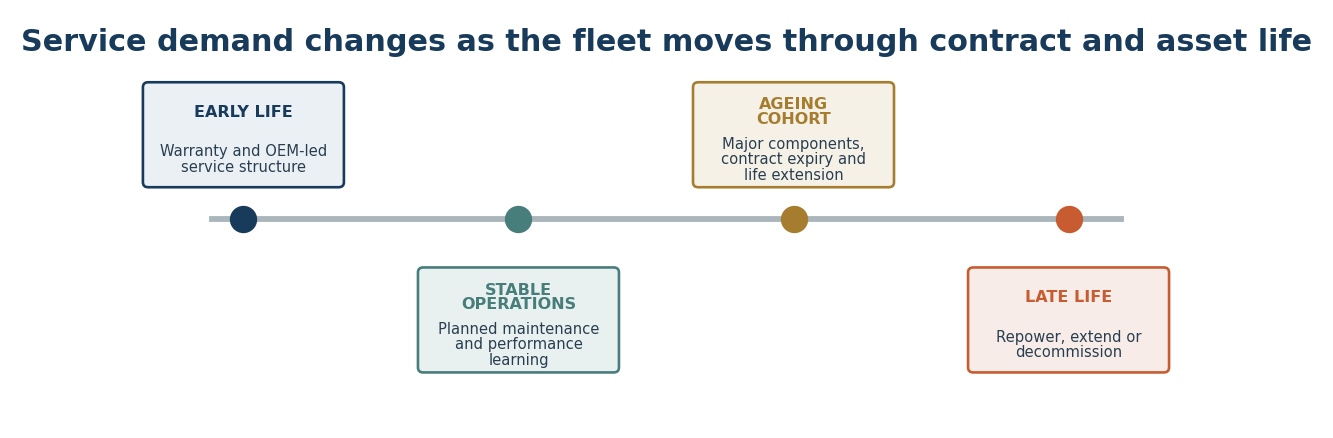
Three fleet cohorts
COHORT | DOMINANT STRUCTURE | COMMERCIAL QUESTION |
|---|---|---|
Early life | Warranty and OEM-led service | Subcontracting, campaign support and data-access limits |
Stable operations | Predictable planned and corrective work | Efficiency, bundling, local coverage and contract renewal |
Ageing / late life | Major components and strategic asset decisions | Parts, lifting, obsolescence, life extension and repowering interface |
INDUSTRY IMPLICATION Installed capacity alone overstates opportunity. The accessible service pool depends on turbine age, contract coverage, task type, OEM control and the capacity needed to execute safely.
OPERATING SYSTEM
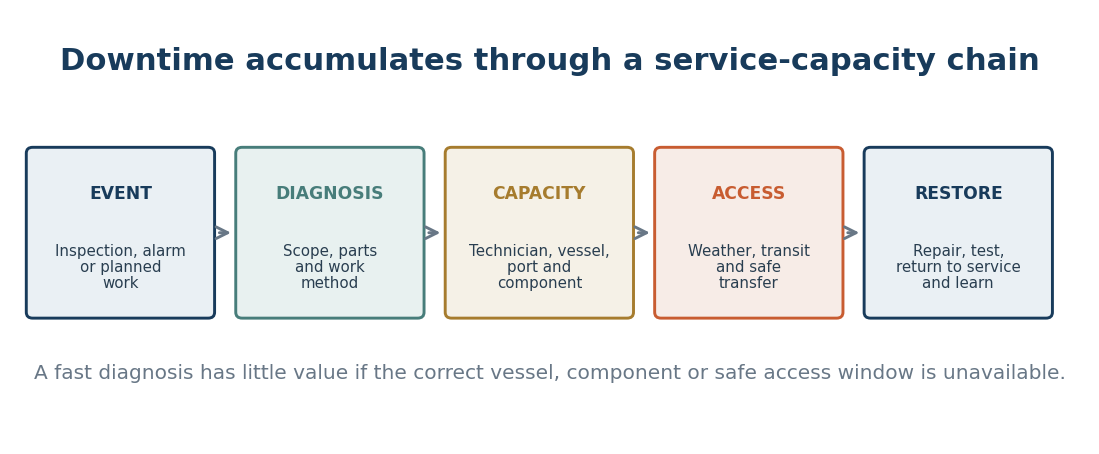
Downtime is shaped by the slowest link in the response chain
The analysis follows service demand from event detection to return to service. It distinguishes technical diagnosis from the physical capacity and access conditions required to complete the work.
Six service packages followed
Remote monitoring and diagnosis; inspection and routine maintenance; corrective repair; major-component exchange; cable and balance-of-plant intervention; late-life and decommissioning preparation.
BOUNDARY CONTROL Vessel availability is matched to task capability, lifting requirement, water depth, port base and weather limit. A vessel count alone is not treated as usable service capacity.
METHODOLOGY
Failure-to-Service Capacity Reconstruction
This method translates fleet cohorts into time-sensitive service workloads and compares them with the technicians, parts, vessels, ports and access windows that can actually complete each task.
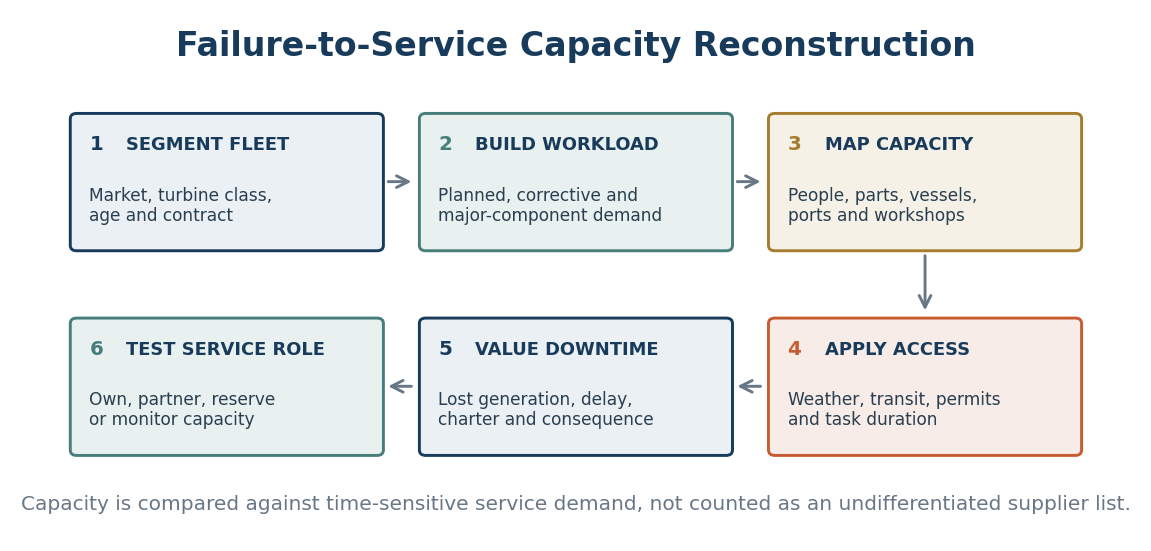
Evidence architecture
EVIDENCE LAYER | WHAT IS RECONSTRUCTED |
|---|---|
Fleet and contracts | Asset location, turbine class, age, operating status, OEM and service agreement |
Workload | Maintenance intervals, inspection needs, corrective events and major-component exposure |
Capacity | Technician skills, spare parts, vessels, cranes, ports, workshops and mobilisation |
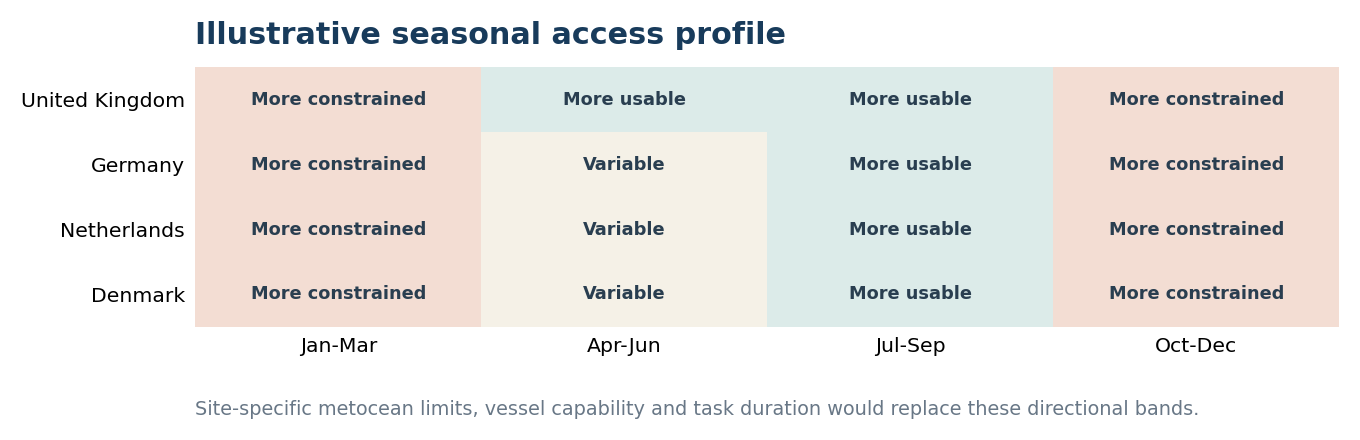
Access | Metocean limits, season, transit, task duration, permits and safety requirements |
Economics | Downtime consequence, charter, standby, lost production, inventory and response commitments |
METHOD CONTROL Failure rates from different turbine classes or operating environments are not blended. Each estimate retains its asset cohort, task definition and uncertainty range.
DECISION OUTPUT
Secure the bottleneck, partner around the rest
The output would identify which capacity the company should own, reserve through long-term agreements, access through partners or leave outside its offer.
RESPONSE | WHEN IT BECOMES CREDIBLE | DECISION FOCUS |
|---|---|---|
Own capacity | Demand is recurring and utilisation can be protected | Technicians, tooling, spares and selected service packages |
Reserve capacity | Scarcity matters but full ownership is uneconomic | Vessel windows, specialist lifting and component availability |
Partner | Capability is critical but outside the company's control boundary | OEM access, ports, heavy logistics and regional coverage |
Monitor | Demand or technical route remains uncertain | Fleet ageing, contract expiry, failures and tender signals |
What the client receives
Fleet-cohort map; contract and service-boundary analysis; task-specific demand model; service-capacity chain; seasonal access view; supplier and partnership architecture; downtime exposure model; capacity ownership logic; decision triggers and monitoring dashboard.
Recommended decision sequence
- Define the accessible fleet by cohort, contract and task type.
- Translate service events into time-sensitive people, parts, vessel and port requirements.
- Value delay and capacity under realistic access conditions.
- Own or reserve only the bottlenecks that create repeatable strategic control.
NOTE This example demonstrates a possible Industry Analysis engagement. It does not present client results, asset recommendations or a vessel-investment conclusion.
Contact Us
Discuss the fleet cohorts, service packages and North Sea markets you need to understand. August Research can connect operating demand, access constraints and capacity economics into a clear service-position decision.
August Research | Market & Business Intelligence