PHASE 2 · INNOVATION LANDSCAPE MAPPING · ENGAGEMENT 04
Mapping a megawatt-charging ecosystem for cross-border electric freight
A corridor-operability study to determine whether charging sites, grid capacity, vehicles, standards, commercial access and fleet schedules will mature as one usable system.
THE DECISION
Should a charging operator develop six high-power sites on a Rotterdam-to-Warsaw freight corridor, and which locations and partnerships can support dependable cross-border operations by 2028?
Engagement at a glance
European charging-infrastructure developer working with logistics fleets, site owners and energy partners.
Netherlands, Germany and Poland, with European standards and fleet signals included.
Public regulatory, technical, infrastructure and vehicle activity from 2022 to August 2026.
Prioritise corridor sites and partnership sequencing for commissioning between 2027 and 2029.
The situation
A map of announced truck chargers does not show whether a heavy-duty electric vehicle can complete a route. Each stop must be compatible with truck geometry, charging curve, connector, driver break, queue behaviour, payment and fleet schedule. The site must also have a realistic grid-connection and permitting path.
The client is considering six locations across three countries. Some have logistics demand but uncertain power. Others have strong grid access but weak fleet commitment. Cross-border roaming, tariffs and operational support create further dependencies. The decision is therefore about corridor operability, not charger count.
Why the corridor decision is time-sensitive
The EU Alternative Fuels Infrastructure Regulation requires progressive heavy-duty charging coverage along the TEN-T network. By 2030, core-network pools are to be no more than 60 km apart in each direction, provide at least 3,600 kW and include at least two 350 kW points. Comprehensive-network pools have a 100 km maximum spacing and at least 1,500 kW total output.
The equipment interface is also becoming more concrete. IEC TS 63379:2026 defines the MCS coupler and cable assembly up to 1,500 V DC and 3,000 A. IEC 61851-23-3:2026, published in August 2026, specifies MCS charging equipment and links control communication to ISO 15118-10 and ISO 15118-20.
Deployment has moved into public demonstration. Fraunhofer ISI reported Germany’s first public MCS point under the HoLa project in September 2025, with four motorway sites planned. The European Commission separately announced support in 2025 for 39 alternative-fuels projects expected to add 626 megawatt chargers. Standards and funding are accelerating, but grid and operational readiness remain location-specific.
The site-to-route conversion problem
A megawatt charger is only one element of a freight service. The vehicle charging curve, available site power, transformer and storage design, connector cooling, bay access, driver rest timing, queue discipline, tariff and payment system, roaming agreement, maintenance response and border-to-border route plan must operate together. A single weak stop can make the whole corridor unreliable.
What the study must resolve
- Which candidate sites can meet grid, land, permit, truck-access and commissioning requirements on the needed date.
- Which OEM fleets and duty cycles create dependable demand rather than broad electrification interest.
- Where MCS, CCS and depot charging should be combined to protect route completion and asset utilisation.
- Which cross-border standards, roaming, tariff and data relationships must be aligned before commercial launch.
CORE RESEARCH QUESTION
Which sequence of sites, technical configurations and commercial partners can make the corridor operationally reliable for target fleets, not merely compliant on paper?
How corridor operability is reconstructed
The research follows representative truck missions through the corridor. Each stop is evaluated as a bundle of power, hardware, access, demand and operational services, then linked to the regulatory and standardisation milestones that affect commissioning.
01 Define the mission set
Specify origin-destination pairs, payload, tractor and battery class, usable energy, seasonal consumption, driver hours, required reserve, depot access and target freight schedules.
02 Model charging opportunities
Separate depot, destination, public corridor, secure-parking and contingency charging. Calculate the power and dwell window required for each mission rather than assuming every stop needs MCS.
03 Build the site-readiness taxonomy
Capture land control, truck circulation, bay geometry, grid application, connection date, available capacity, transformer, storage, permit, construction and operating partner.
04 Map vehicle and interface readiness
Record OEM model, charging voltage and current, charging curve, MCS availability, inlet position, thermal limits, communications and expected fleet delivery.
05 Reconstruct commercial access
Identify charging operators, roaming platforms, fleet contracts, tariff method, reservation, payment, data exchange, service-level commitments and cross-border tax handling.
06 Overlay regulatory and standards milestones
Map AFIR targets, relevant national programmes, IEC and ISO standards, metering, cybersecurity and grid-code requirements to each candidate site.
07 Stress-test the corridor
Run representative missions against site outages, queues, reduced power, winter consumption and delayed commissioning to expose single-point failures.
08 Prioritise the build sequence
Rank sites by route criticality, readiness, fleet commitment, redundancy, grid risk and the value of pairing public charging with depot or destination capacity.
Operability evidence rule
An announced charger is not counted as available corridor capacity. The evidence must identify location, access, intended vehicle class, power configuration, commissioning status and operator. Vehicle capability and grid connection are dated separately because they can mature on different schedules.
Website presentation suggestion: allow the visitor to choose a truck mission and departure date. The corridor should then reveal the stops, dwell assumptions and missing readiness blocks that determine route completion.
Corridor scope and operating fields
The scope integrates technical and commercial readiness at site level so that corridor risk can be understood before capital is sequenced.
Readiness layer | Parameters examined | Evidence captured |
|---|---|---|
Vehicle mission | Battery, usable energy, consumption, payload, route, reserve, dwell and driver hours | OEM data, fleet trial, route plan and delivery timing |
Charging interface | MCS or CCS, voltage, current, charging curve, cooling, inlet and communication | Standard, vehicle support, charger test and interoperability event |
Site power | Grid capacity, connection date, transformer, storage, solar, peak load and redundancy | Grid offer, permit, engineering award and commissioning signal |
Truck access | Bay geometry, turning radius, trailer, queuing, parking, security and amenities | Site plan, land control, operating hours and vehicle restrictions |
Commercial access | Tariff, reservation, payment, roaming, fleet contract, uptime and service response | Operator agreement, platform support and service commitment |
Policy and funding | AFIR category, TEN-T position, national support, metering, data and cybersecurity | Regulation, funding award, authority decision and compliance date |
Route resilience | Alternative stop, reduced power, outage, queue, winter use and schedule recovery | Scenario result, single-point failure and mitigation owner |
Participants required for a usable corridor
- Fleet operators, shippers, truck OEMs, leasing providers and telematics platforms.
- Charging operators, hardware suppliers, site owners, secure-parking operators and maintenance providers.
- Distribution and transmission operators, storage providers, energy suppliers and aggregators.
- Roaming and payment platforms, corridor authorities, standards bodies, national funders and local permitting agencies.
Research boundaries
The study does not replace a grid application, electrical design, traffic study, civil survey, permitting opinion, vehicle trial or financial model. Public station data may lag commissioning or omit operational restrictions, so priority locations require direct confirmation.
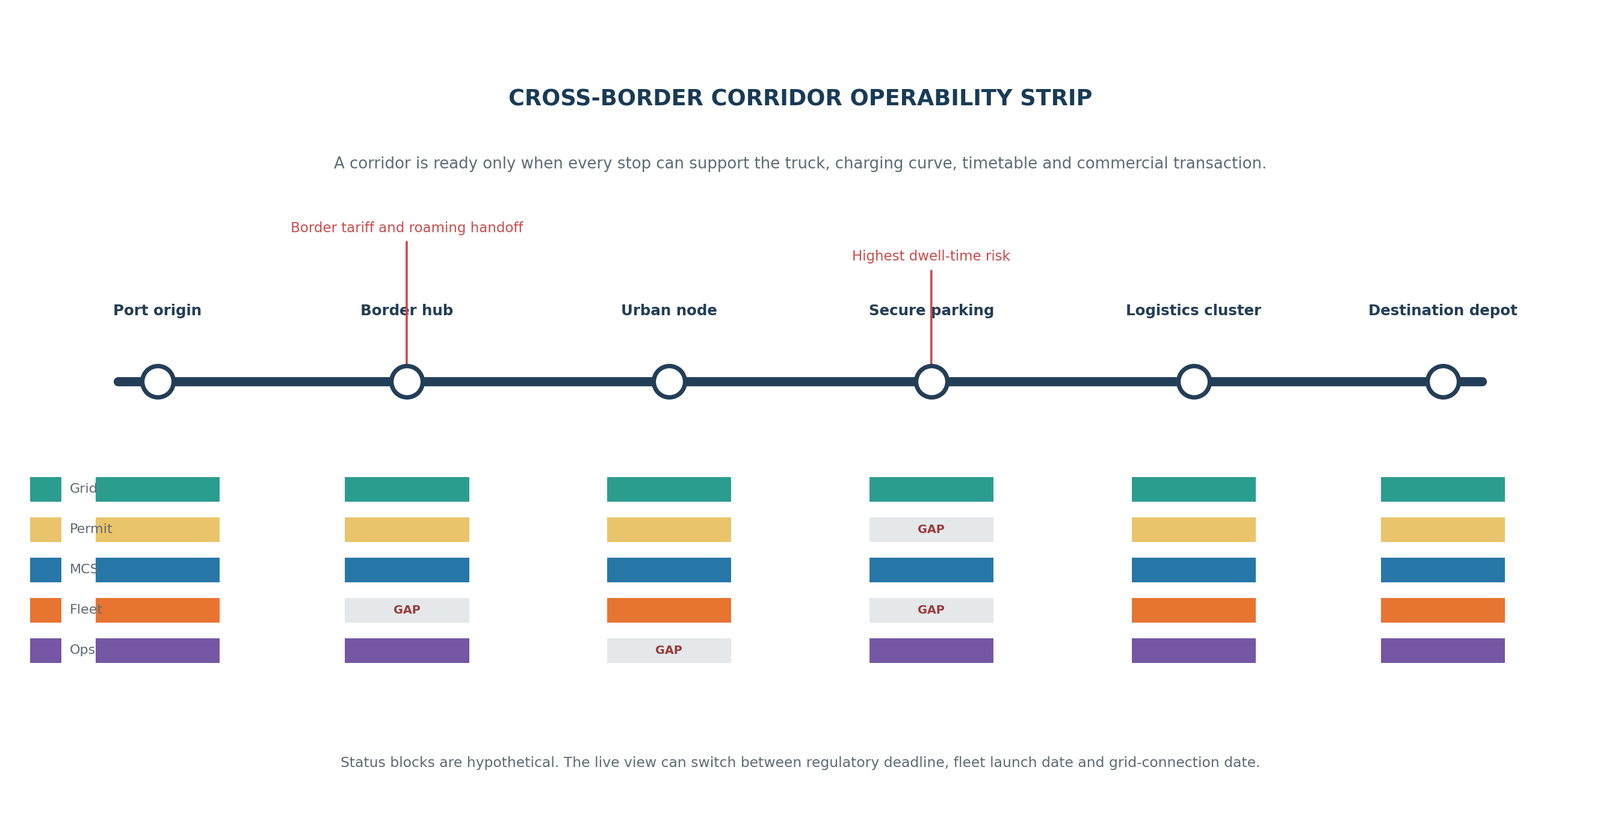
Example output: Cross-Border Corridor Operability Strip
The output treats the route as a chain of operating checkpoints. Each candidate stop contains five readiness blocks: grid, permit, MCS interface, committed fleet demand and operations. A route remains at risk until critical gaps have an owner and a dated closure path.
How a decision-maker would use it
- Select a freight mission to display the stops it actually needs and the energy reserve at arrival.
- Switch between the 2027, 2028 and 2030 views to compare commissioning against AFIR and fleet milestones.
- Open a gap block to see the missing evidence, responsible organisation and latest feasible closure date.
- Test an outage or reduced-power scenario and identify whether the next viable stop remains reachable.
Hypothetical evidence volume
176 retained across sites, grids, vehicles, standards and funding.
Mapped across 14 ecosystem roles in three countries.
Reduced to 18 route-relevant sites and six priority investment locations.
Tested across vehicle, season, dwell and disruption assumptions.
Website presentation suggestion: turn the corridor strip into a mission simulator. Visitors should be able to change vehicle range, dwell time or site availability and see which dependency breaks first.
What the output might reveal
The findings below demonstrate how the mapped evidence could support the decision. They are hypothetical and would change with the evidence collected.
Grid date, not charger specification, may control the build sequence. Several high-demand locations could remain unsuitable for first-wave investment if firm connection capacity trails fleet launch by two or more years.
Every site does not need the same charging mix. A corridor can combine MCS at time-critical hubs with high-power CCS, depot charging and destination charging where dwell is naturally longer.
Fleet commitment should be corridor-specific. A memorandum covering vehicle numbers is weaker than a mission-level commitment that identifies routes, arrival windows, energy demand and charging alternatives.
Cross-border operations create a software and service dependency. Reservation, authentication, tariff visibility, payment, data exchange and fault escalation must work across operators and countries if the route is to be dependable.
Recommended decision route
PROVISIONAL DIRECTION
Prioritise three anchor sites with firm or advanced grid pathways and fleet missions that cannot be served reliably elsewhere. Develop the remaining locations as redundancy and coverage sites, using modular power expansion and a common roaming and service architecture.
Decision gates
- Gate 1: Secure dated grid offers and truck-access control for each anchor location.
- Gate 2: Validate representative vehicles against connector, charging-curve, bay and dwell assumptions.
- Gate 3: Convert fleet interest into route-level energy and timing commitments.
- Gate 4: Demonstrate cross-border reservation, payment, data and fault-response processes before launch.
Indicative project delivery
A three-country corridor map would typically take 8 to 10 weeks. The work would combine mission definition, site and grid evidence capture, vehicle and standards mapping, commercial-relationship analysis, corridor stress testing, build-sequence prioritisation and a decision workshop. Timing depends strongly on public access to grid and permitting data.
Site, grid, vehicle, standard, funding and commercial records with dates and links.
Land, access, grid, permit, hardware, fleet and operations fields for each location.
Representative truck routes, energy, dwell, reserve and disruption scenarios.
Interactive-ready route structure plus dated static readiness views.
Anchor, redundancy and monitor sites with dependency owners and gates.
Recommended corridor, partnership plan, risk scenarios and monitoring triggers.
Questions reserved for primary validation
- What firm grid capacity and connection date will the network operator commit to at each anchor site?
- How does the actual truck charging curve behave across the intended state-of-charge and temperature window?
- What route volume and arrival distribution will each fleet contractually or operationally support?
- Can drivers reserve, authenticate, pay and obtain support consistently across all three countries?
Let’s discuss your project
If truck-charging investments are being evaluated across a freight route, site announcements are not enough. Share the corridor, target fleets, commissioning window and current site options, and the ecosystem can be mapped around real route completion and investment sequence.
Note:
The engagement, client profile, evidence counts, findings and recommendations are hypothetical. Industry context is grounded in publicly available information. Project timing is indicative and depends on taxonomy breadth, source accessibility, language and geographic coverage, evidence quality and profiling depth. Secondary research does not independently validate technical performance, regulatory status, qualification, freedom to operate or commercial access.