PHASE 2 ILLUSTRATION / OFFSHORE WIND
Selecting an Offshore Wind
Operations Partner
How an asset owner could test whether a lower-cost maintenance provider can actually protect availability across weather, vessel and component constraints.
DECISION
PORTFOLIO
CANDIDATES
SERVICE HORIZON
Appoint an O&M partner
50 offshore turbines
3 shortlisted providers
Five-year term
DECISION QUESTION Which provider should receive the multi-year service mandate, and what operating conditions are required to prevent a low-price award from becoming a high-downtime relationship?
The hypothetical client owns a 50-turbine North Sea wind portfolio approaching the end of its original service arrangement. It requires planned maintenance, remote diagnostics, offshore access, major-component coordination and 24-hour incident response under a five-year contract.
Provider A has the strongest OEM-linked technical depth, but its vessel access and mobilisation model is comparatively rigid. Provider B combines regional marine coverage with a dedicated planning cell and open operational data. Provider C submits the lowest price and the fastest nominal response promise, although its heavy-repair capacity depends on third parties.
Why response time is not the same as recovery capability
The initial commercial comparison treated a guaranteed response time as the primary proxy for service quality. The relationship changed when performance was reconstructed as a chain: an alarm must be interpreted, the correct team and parts must be available, a vessel must mobilise, the turbine must be safely accessed, and the repair must be completed within a usable weather window.
Promise-to-performance gap Provider C could acknowledge an incident quickly, yet its evidence was weaker at the mobilisation, access and heavy-repair stages where downtime accumulates.
Access dependency Provider A had deep technical capability but relied on vessel arrangements that were not consistently prioritised for the client's region.
Integrated operating model Provider B did not lead every technical category, but it showed the most coherent link between monitoring, marine logistics, spares, field teams and escalation governance.
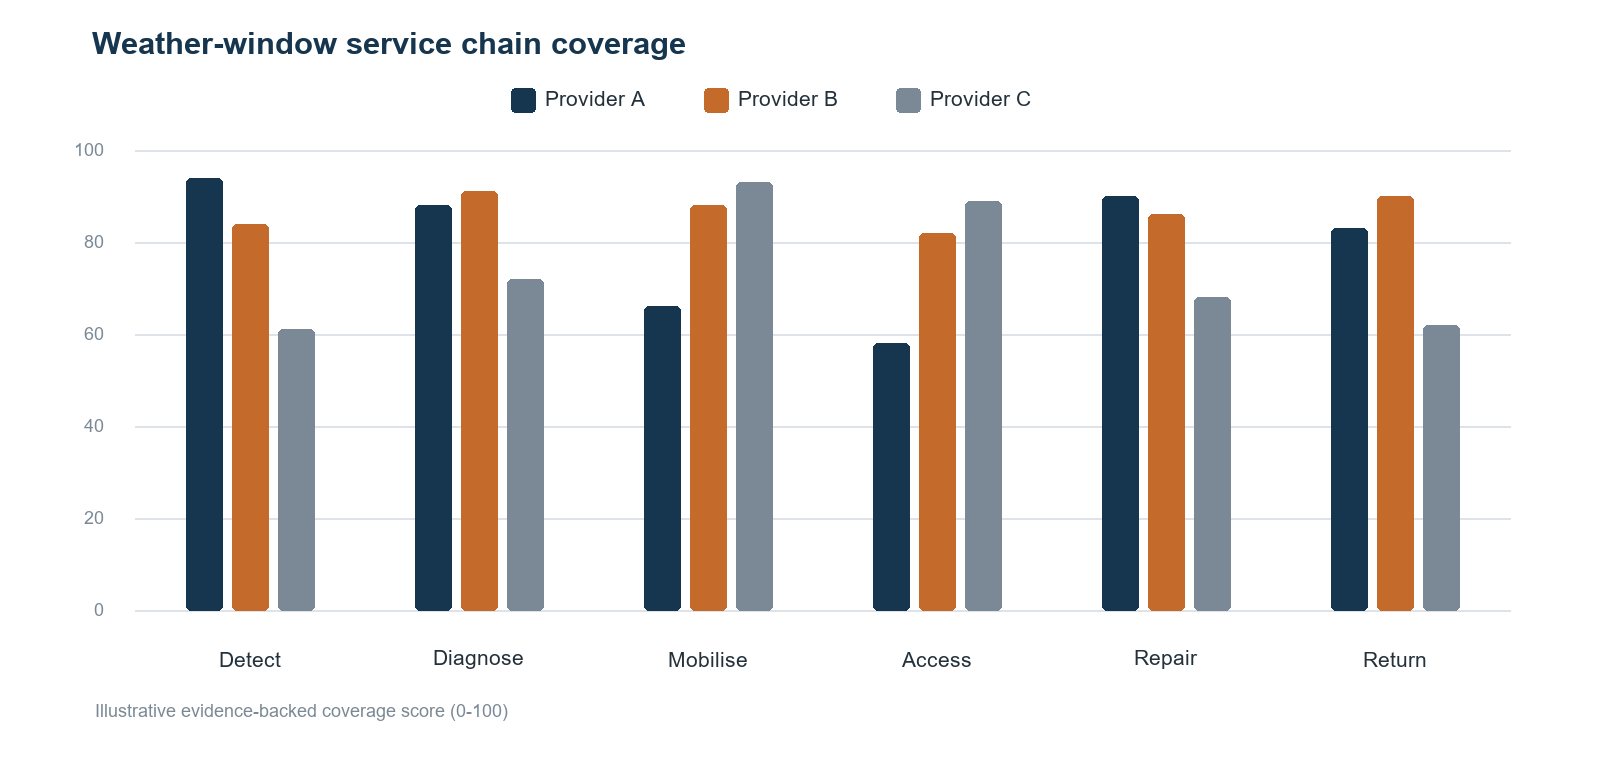
Methodology: Weather-Window Service Reliability Chain
The assessment follows the full route from fault detection to resumed generation and tests whether each provider controls the dependencies that determine lost production.
Event-path reconstruction Translate service promises into the operational steps, decision rights, people, parts, vessels and weather conditions required for a repair to reach completion.
Regional resource verification Separate network-wide capability from the vessels, technicians, warehouses and specialist subcontractors realistically available to this portfolio.
Window-capture analysis Test whether scheduling, permits, marine coordination and parts readiness allow the provider to use the first safe access window rather than merely respond administratively.
Downtime economics Convert differences in mobilisation and recovery into comparable lost-generation exposure alongside contract price and service credits.
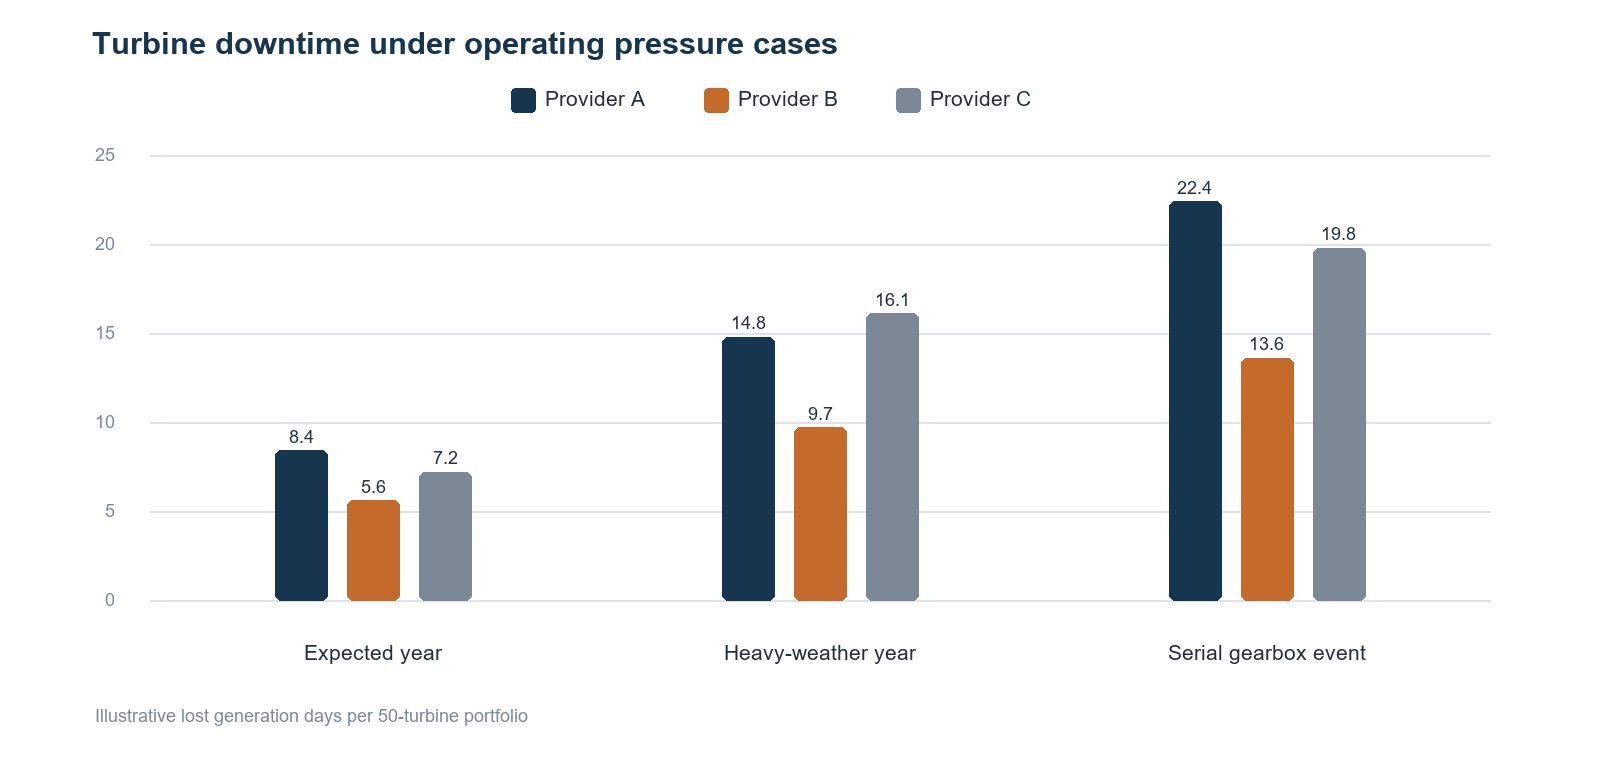
Failure-cluster stress test Examine heavy-weather periods, concurrent faults and major-component events to reveal resource contention and subcontractor dependence.
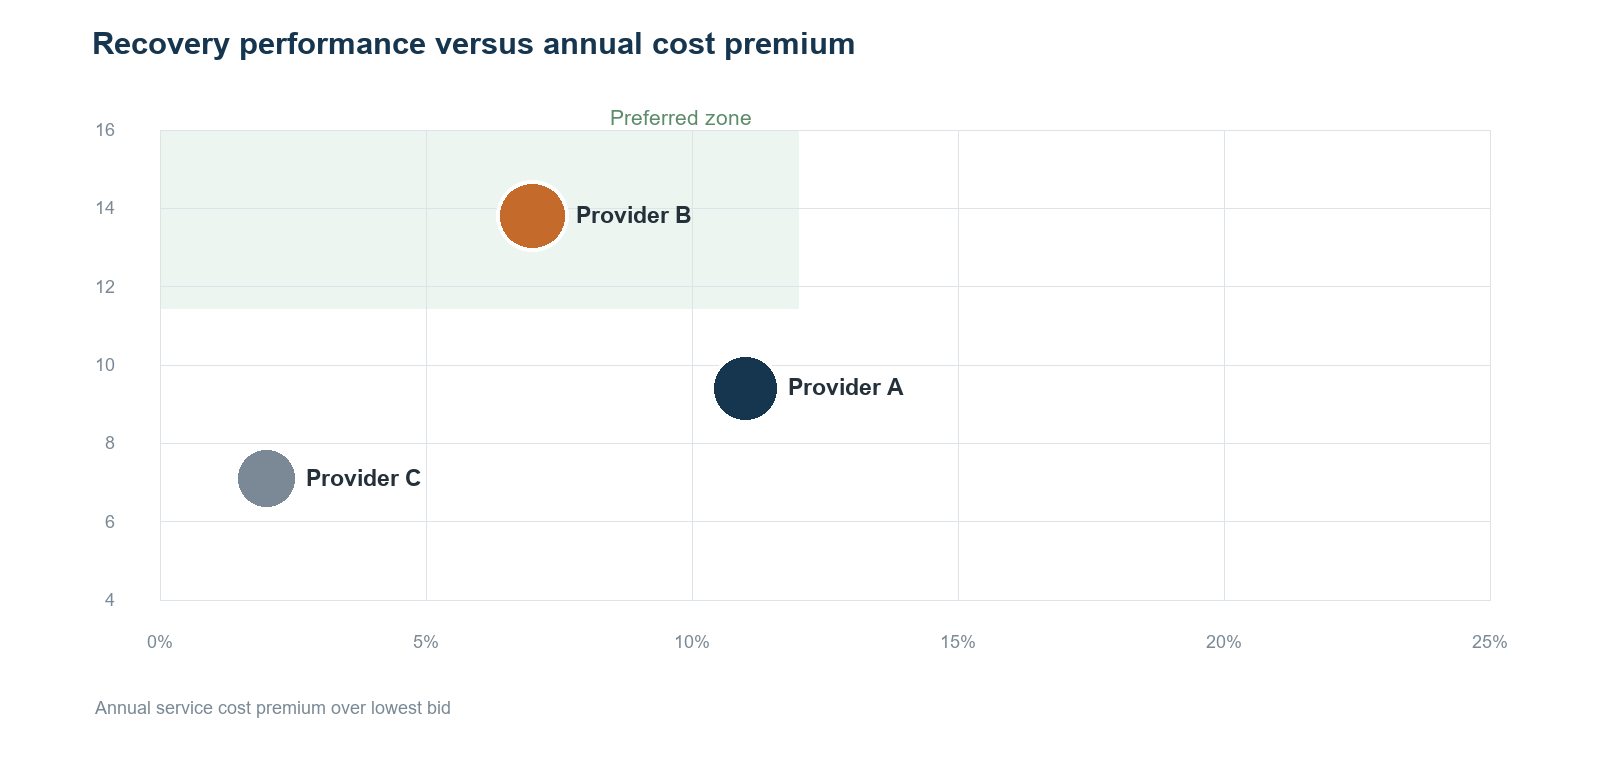
The candidate evidence picture
Decision factor | Provider A | Provider B | Provider C |
|---|---|---|---|
24-hour monitoring | OEM-integrated centre | Regional control room | Partner-operated desk |
Dedicated marine access | Framework allocation | Reserved CTV capacity | Spot and subcontracted |
Heavy-repair capability | Strong, OEM-led | Managed specialist pool | Third-party dependent |
Critical spares position | Central warehouse | Regional stock agreement | Limited local holdings |
Operational data access | Restricted interfaces | Open client dashboard | Basic monthly reporting |
Illustrative annual fee | EUR 8.9m | EUR 8.6m | EUR 8.0m |
Evidence confidence | 84 / 100 | 88 / 100 | 68 / 100 |
The comparison is not a final technical or marine-safety qualification. It demonstrates how secondary evidence can expose whether the proposed operating model is controlled by the bidder, dependent on unverified partners or vulnerable to regional resource contention.
Recommended relationship decision
APPOINT WITH PERFORMANCE CONTROLS Select Provider B as the preferred O&M partner, subject to ring-fenced marine access, minimum critical-spares holdings, named heavy-repair capacity and client access to event-level operational data.
Required condition | Decision control | Escalation trigger |
|---|---|---|
Marine access | Reserved vessel days with priority rules | Two usable windows missed for resource reasons |
Critical spares | Agreed local stock and replenishment floor | Any critical item below minimum for 30 days |
Specialist repair | Named framework partners and call-off terms | Capacity cannot be confirmed within 24 hours |
Operational transparency | Shared event log and recovery dashboard | Material event data delayed beyond five days |
Contingency | Maintain Provider A for defined OEM interventions | Failure exceeds B's authorised repair scope |
Provider A should remain available for specialist OEM-linked interventions. Provider C should not receive the full mandate until its marine and heavy-repair dependencies are converted into verifiable, contractually prioritised capacity.
What August Research would deliver
Service-chain dossier A decision-led reconstruction of the complete response and recovery model, including controlled resources and external dependencies.
Regional capability map Evidence on technicians, vessels, warehouses, subcontractors and competing commitments relevant to the operating region.
Downtime and stress model Expected and pressure-case downtime exposure translated into operational and commercial consequences.
Appointment control plan Qualification conditions, contract evidence, service triggers and contingency activation points.
Indicative project delivery
Stage | Focus | Indicative timing |
|---|---|---|
Mandate definition | Portfolio, service scope, exclusions and availability priorities | Week 1 |
Operating model reconstruction | Resources, access, spares, repair and subcontracting | Weeks 1-2 |
Candidate comparison | Service chain, cost, data and governance | Weeks 3-4 |
Pressure testing | Weather, concurrent faults and major components | Week 5 |
Decision package | Recommendation, controls and diligence priorities | Week 6 |
Scope boundary
This illustration represents secondary research and supplied-document analysis conducted before technical inspections, marine-safety review, contract negotiation and operational mobilisation.
All providers, fees, performance measures, capacity statements, findings and recommendations in this illustration are hypothetical and are included only to demonstrate the methodology.
LET'S DISCUSS YOUR SERVICE-PARTNER DECISION August Research can reconstruct the operating evidence behind an O&M shortlist, test the reliability of service promises and define the conditions required for appointment.
EVALUATE AN O&M PARTNER | PROTECT ASSET AVAILABILITY