PHASE 2 ILLUSTRATION 2 DATA CENTRE INFRASTRUCTURE
Strategic Business Intelligence Data Centre Cooling Portfolio
An illustrative decision case for a European cooling equipment company responding to power constraints and high density computing
DECISION
PIPELINE
OPPORTUNITY
HORIZON
Staged portfolio shift
34 projects
EUR 185m
2026 to 2030
Decision question
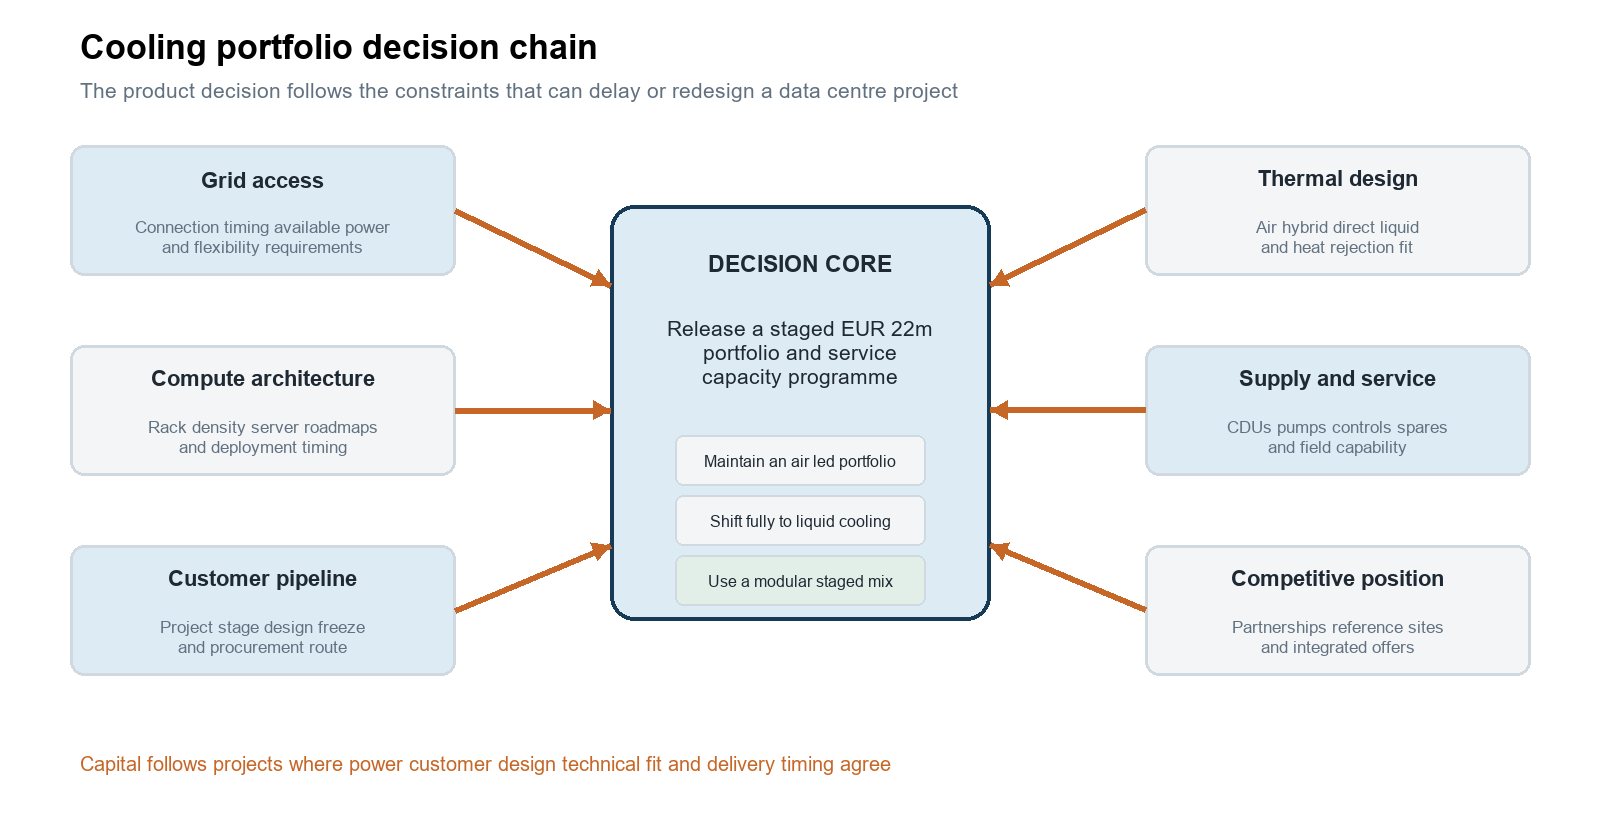
Should the company commit EUR 22 million to expand modular liquid cooling, controls and field service capacity, and which customer projects should receive priority while grid access and computing designs remain uncertain?
Illustrative recommendation
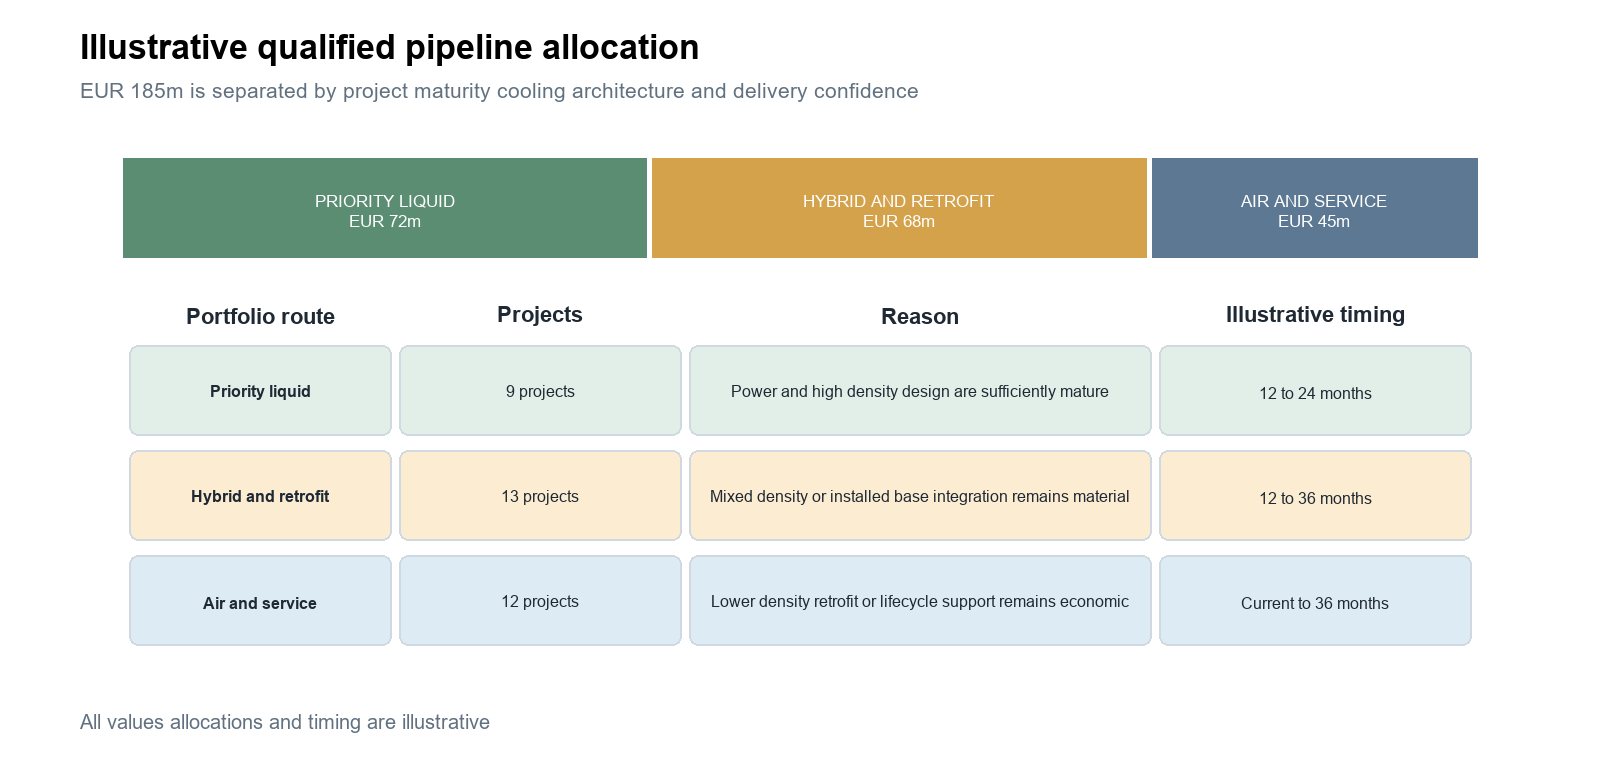
Approve an EUR 8 million first gate for engineering, testing and service readiness around nine priority projects representing EUR 72 million of the qualified pipeline. Keep hybrid air and liquid systems available for thirteen retrofit and mixed density projects. Release the remaining EUR 14 million only after customer designs, power availability and component commitments meet the agreed thresholds.
The hypothetical client supplies cooling equipment to European data centre developers and operators. Its qualified pipeline contains thirty four projects worth EUR 185 million. All client, project, customer, competitor, commercial, technical and scoring values are illustrative.
Decision Evidence Lattice
Demand growth alone does not determine the right portfolio. A project can disappear or change specification when power is delayed, rack density moves, a server platform changes or a customer selects an integrated infrastructure partner. The decision chain connects those dependencies to the capital release.
Decision condition | Illustrative interpretation | Effect on the route |
|---|---|---|
Project density | Fourteen of thirty four projects plan zones above fifty kilowatts per rack | Increase liquid cooling engineering coverage without assuming every hall has the same design |
Power timing | Eleven projects have unresolved connection timing beyond the current development schedule | Do not reserve scarce components until the power case is credible |
Qualified opportunity | Nine projects worth EUR 72 million combine design maturity with a clear liquid cooling requirement | Concentrate the first investment gate on these projects |
Installed base | Thirteen projects still require hybrid or retrofit support | Protect the air and controls portfolio needed during the transition |
Signal interpretation and source architecture
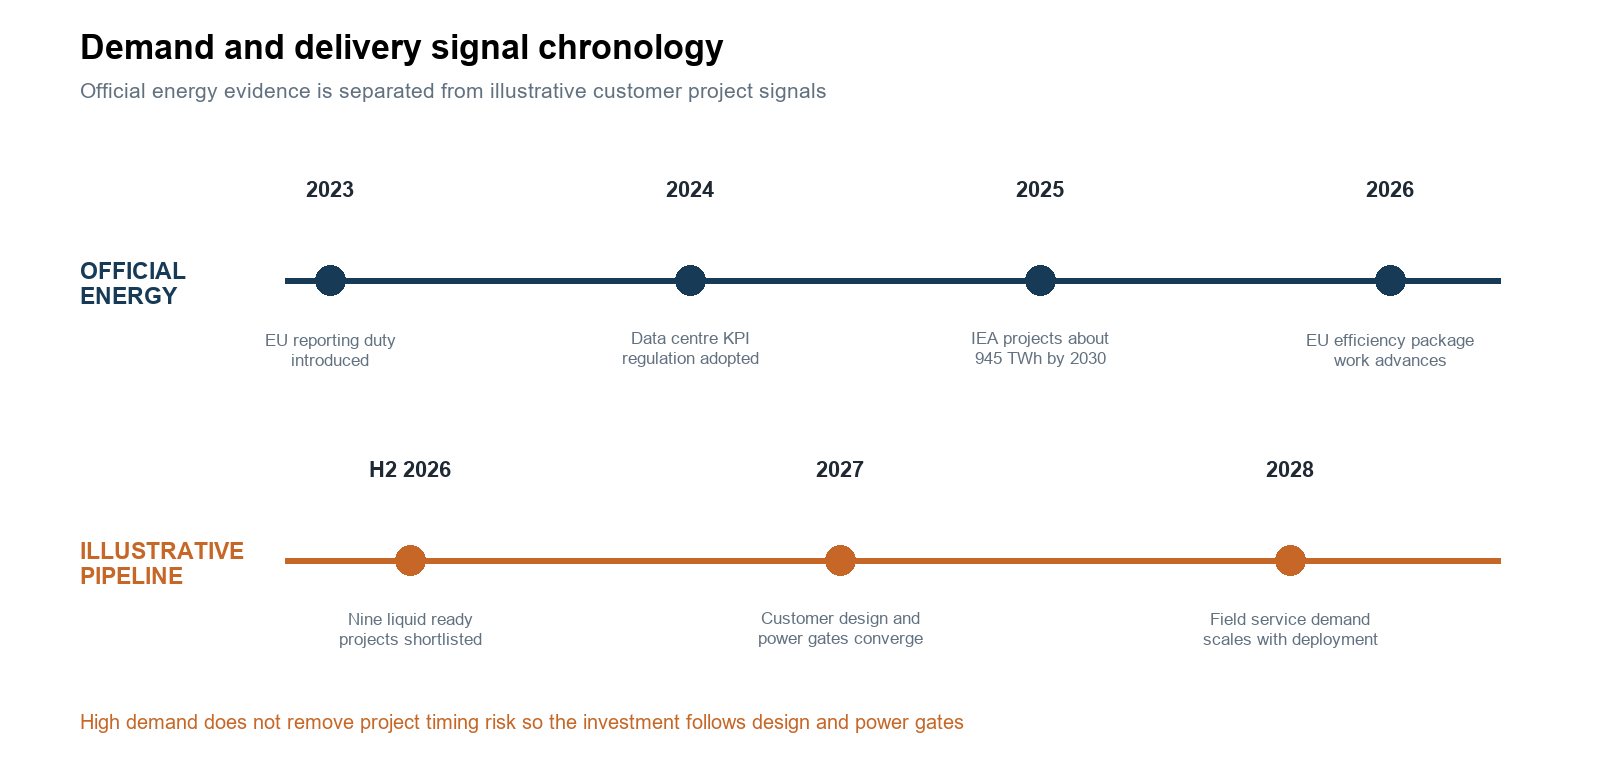
The IEA projects global data centre electricity consumption of about 945 TWh in 2030 and estimates that grid risks could delay part of the planned project pipeline. EU reporting rules also create a growing evidence base for energy and water performance. The illustration separates those official developments from the client's hypothetical project signals.
Evidence stream | Representative source route | Decision use |
|---|---|---|
Energy and policy | IEA Energy and AI, European Commission data centre reporting database, Energy Efficiency Directive and national energy ministries | Test demand direction, energy performance requirements and the timing of policy changes |
Grid and planning | Transmission and distribution operator connection registers, planning portals, environmental permits and utility consultations | Identify projects with credible power, approval and construction schedules |
Customer projects | Client CRM, tender documents, operator announcements, planning applications and contractor awards | Separate early concepts from funded projects approaching design freeze |
Technology and supply | Server and cooling specifications, Open Compute Project material, patents, supplier lead times, partnerships and hiring | Match cooling architecture to rack design and test delivery readiness |
Portfolio allocation and transition sequence
The pipeline is allocated by evidence, not by a single forecast of liquid cooling adoption. Project maturity, available power, facility design, server compatibility, procurement route, service coverage and contribution margin determine the commercial route.
Portfolio route | Evidence to confirm before release | Management treatment |
|---|---|---|
Priority liquid | Power path, design freeze, server compatibility, component allocation and service plan | Release engineering and customer qualification capacity |
Hybrid and retrofit | Density mix, interface ownership, retrofit downtime and heat rejection limits | Maintain configurable modules and convert when project evidence improves |
Air and service | Installed base economics, replacement cycle, efficiency need and account retention value | Protect profitable lifecycle revenue and avoid premature withdrawal |
The allocation remains provisional until the relevant evidence passes the stated decision threshold.
Decision routes and pressure cases
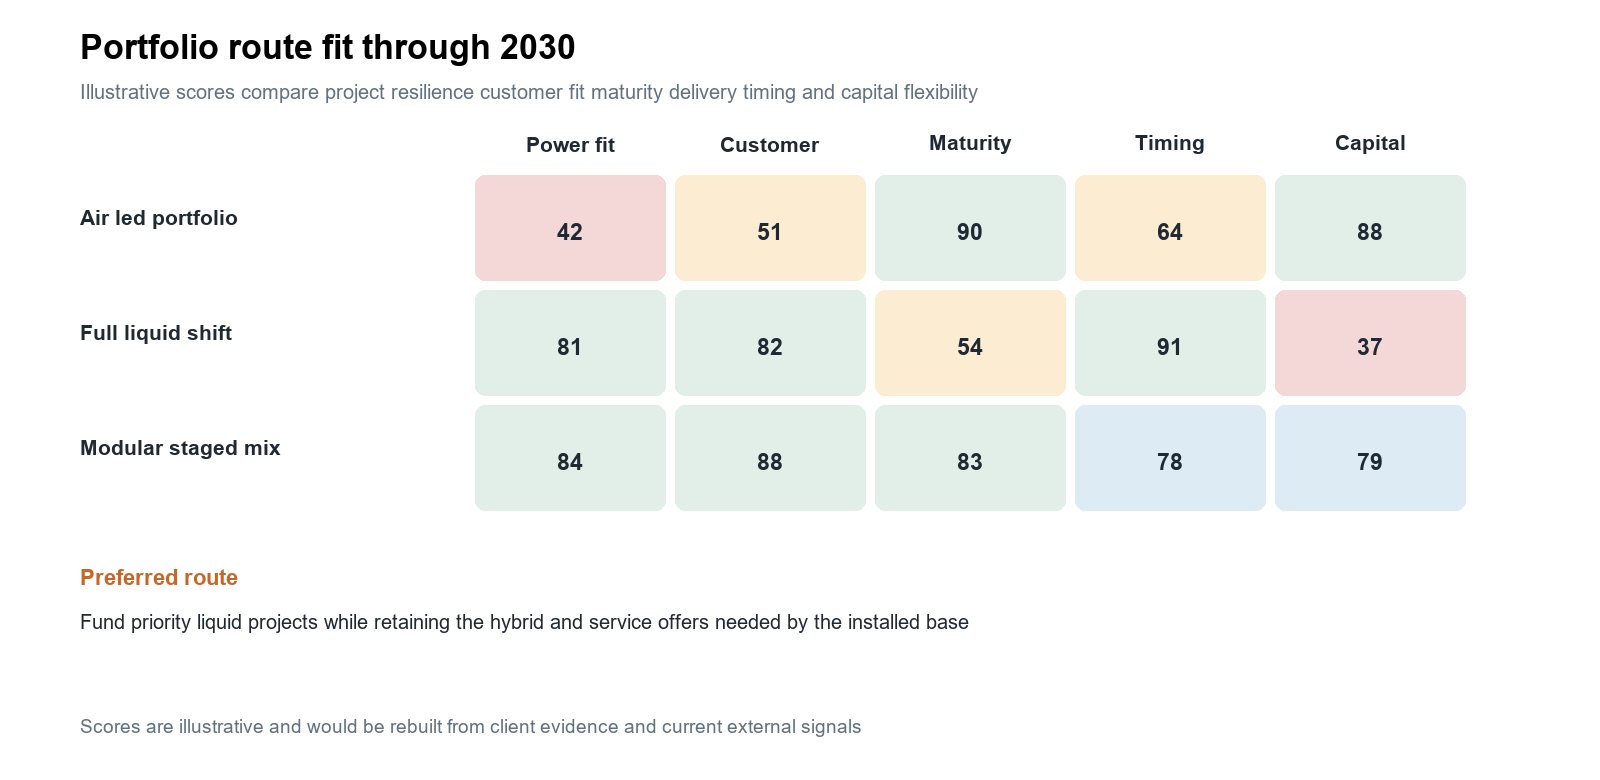
An air led portfolio preserves current capability but weakens access to high density projects. A full liquid shift increases exposure to projects that may be redesigned or delayed. A modular staged mix builds the required capability around qualified projects and keeps the remaining capital reversible.
Pressure cases
- Grid connection slips by eighteen months Keep engineering support but defer component reservation and factory expansion until a revised energisation plan is evidenced.
- Rack density advances faster than expected Move additional modular capacity into the first wave and secure interfaces with server and rack partners.
- Critical component lead times extend Prioritise projects with firm design and margin, qualify second sources and avoid unsupported customer dates.
- Customers favour integrated infrastructure suppliers Use partnerships or bundled controls and service rather than competing as a stand alone equipment vendor.
Recommended strategic decision
Approve the modular staged mix subject to six gates. The first release builds application engineering, test capacity, controls integration and field service around the nine priority projects. Factory expansion and long lead commitments remain conditional on power, design and customer evidence.
Decision gate | Illustrative acceptance condition | Action if unmet |
|---|---|---|
Power credibility | Connection or on site supply evidence supports the customer's construction schedule | Defer long lead commitments |
Design maturity | Rack density, server platform, coolant loop and heat rejection interfaces are controlled | Keep the offer at concept stage |
Customer commitment | Commercial path and technical sponsor are confirmed for projects covering at least seventy percent of first wave value | Reduce the first wave |
Component readiness | Qualified sources meet reliability, certification and delivery requirements | Redesign, dual source or delay |
Service coverage | Commissioning and response capability match the proposed installed base | Limit geography or add a partner |
Capital stage | The EUR 8 million gate produces evidence needed before the remaining EUR 14 million is released | Stop at the reversible gate |
What would change the recommendation
A sustained shift back to lower density designs, repeated grid delays, weak customer commitment or unresolved component qualification would reduce the programme. Earlier design freezes, contracted service demand and successful reference deployments would support earlier release of the second gate.
Decision control plan
Management would review power milestones, planning status, customer design freezes, rack density, server partnerships, component lead times, bid conversion, reference site performance, service response and capital consumed. Each signal would have an owner and an action threshold.
First one hundred and twenty days
- Fix the project universe Reconcile the thirty four projects across CRM, planning, utility and contractor evidence and remove duplicate or speculative capacity.
- Build the constraint chain Connect power timing, computing design, thermal architecture, procurement stage, component needs and field service coverage.
- Validate the nine priority projects Confirm customer sponsors, design assumptions, decision dates, technical interfaces and commercial value.
- Test the operating model Compare internal build, specialist partnership and contract manufacturing for engineering, components and service.
- Issue the first capital decision Approve a project linked resource plan and define the proof required for factory expansion.
What August Research would deliver
- Project evidence register A source linked pipeline with power, planning, design and commercial confidence for each project.
- Cooling architecture map The air, hybrid and liquid requirements attached to project and server design evidence.
- Portfolio allocation Products, engineering capacity and service coverage assigned to qualified opportunity groups.
- Investment pressure test Alternative portfolio routes, adverse conditions and the breakpoints that change capital timing.
- Decision control plan Indicators and actions for expanding, holding, partnering or stopping.
Scope boundary
This illustration demonstrates secondary research and strategic decision analysis. It does not replace electrical or mechanical design, grid studies, equipment certification, site engineering, customer contracting, factory design or supplier diligence.
The client, products, customers, competitors, projects, assets, financial values, scores, thresholds and recommendation are hypothetical. Official sources are included to demonstrate the evidence routes an engagement would use.