PHASE 2 ILLUSTRATION 4 COMMERCIAL INSURANCE
Strategic Business Intelligence Regional Commercial Property Insurance
An illustrative decision case for an insurer resetting participation across a climate exposed regional property portfolio
DECISION
FOOTPRINT
PREMIUM
RENEWAL
Tiered participation
38 counties
USD 420m
2027
Decision question
How should the insurer change participation across thirty eight counties and five building archetypes for the 2027 renewal, given changing hazard, loss, rebuilding cost, regulation, reinsurance and competitor appetite?
Illustrative recommendation
Replace the current region wide appetite with county and building archetype tiers. Reallocate USD 320 million of aggregate limit away from high hazard accounts with weak controls and toward better protected risks in counties where pricing, reinsurance and service economics remain acceptable. Keep any reduction conditional on filing, contract and customer obligations.
The hypothetical client writes USD 420 million of commercial property premium in the southeastern United States. The illustration covers portfolio participation and monitoring, not individual policy pricing. All client, account, county, premium, limit, claims, competitor and scoring values are illustrative.
Decision Evidence Lattice
Regional hazard indicators are too broad for a participation decision. Two accounts in the same county can have different loss potential because construction, roof condition, flood elevation, protection and business continuity differ. The evidence boundary joins those account characteristics with regulation, reinsurance and portfolio concentration.
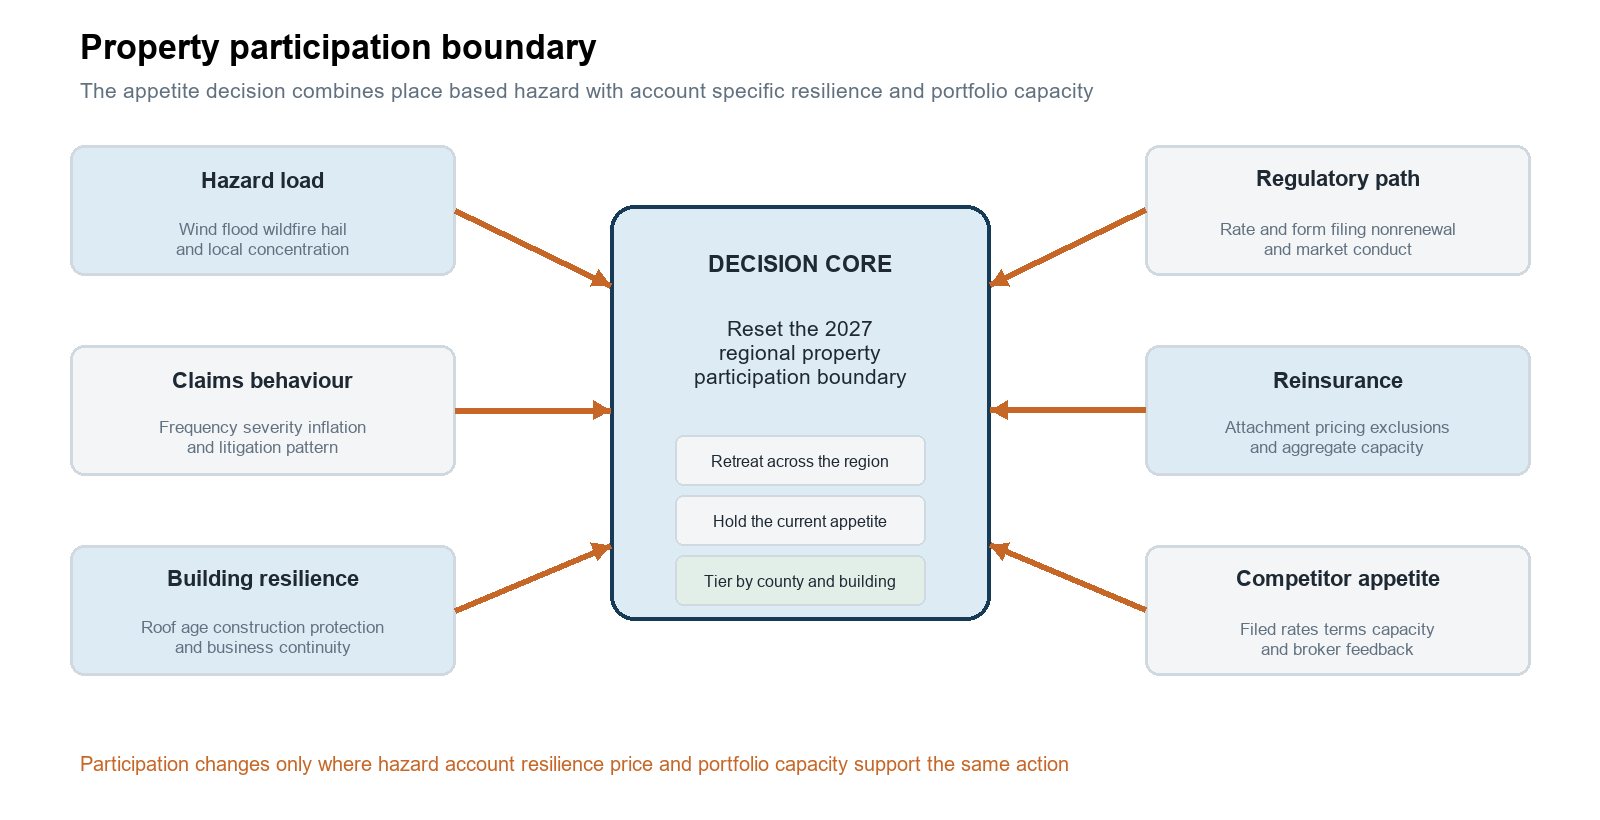
Decision condition | Illustrative interpretation | Effect on the route |
|---|---|---|
Hazard concentration | Nine counties carry forty three percent of modelled catastrophe exposure but twenty seven percent of premium | Reduce aggregate where the price and controls do not support the concentration |
Building quality | The strongest two archetypes show materially better illustrative loss experience after normalisation | Protect capacity for accounts that evidence the required controls |
Reinsurance economics | The current programme makes low attachment growth more expensive in the highest hazard tier | Connect underwriting limits to the reinsurance structure |
Regulatory feasibility | State filing and nonrenewal rules differ across the footprint | Use a jurisdiction specific implementation plan |
Signal interpretation and source architecture
FEMA's National Risk Index provides expected annual loss and hazard measures at county and census tract level. Historical NOAA loss records, state insurance department filings and NAIC data add loss and market context. These sources inform the boundary, but client claims and account attributes determine the underwriting action.
Evidence stream | Representative source route | Decision use |
|---|---|---|
Hazard | FEMA National Risk Index and RAPT, National Flood Hazard Layer, NOAA and state hazard data | Measure place based hazard and distinguish peril, frequency, exposure and expected loss |
Claims and exposure | Client policy, location, limit and claims records, engineering surveys and rebuilding cost indices | Normalise loss by account characteristics and test concentration |
Regulation and market | State insurance department bulletins, rate and form filings, SERFF material where public, NAIC market share and statutory data | Test implementation rules and competitor participation |
Reinsurance and capital | Treaty terms, broker market updates, catastrophe model output and client risk appetite | Connect account decisions to attachment, aggregate cover and capital consumption |
Portfolio allocation and transition sequence
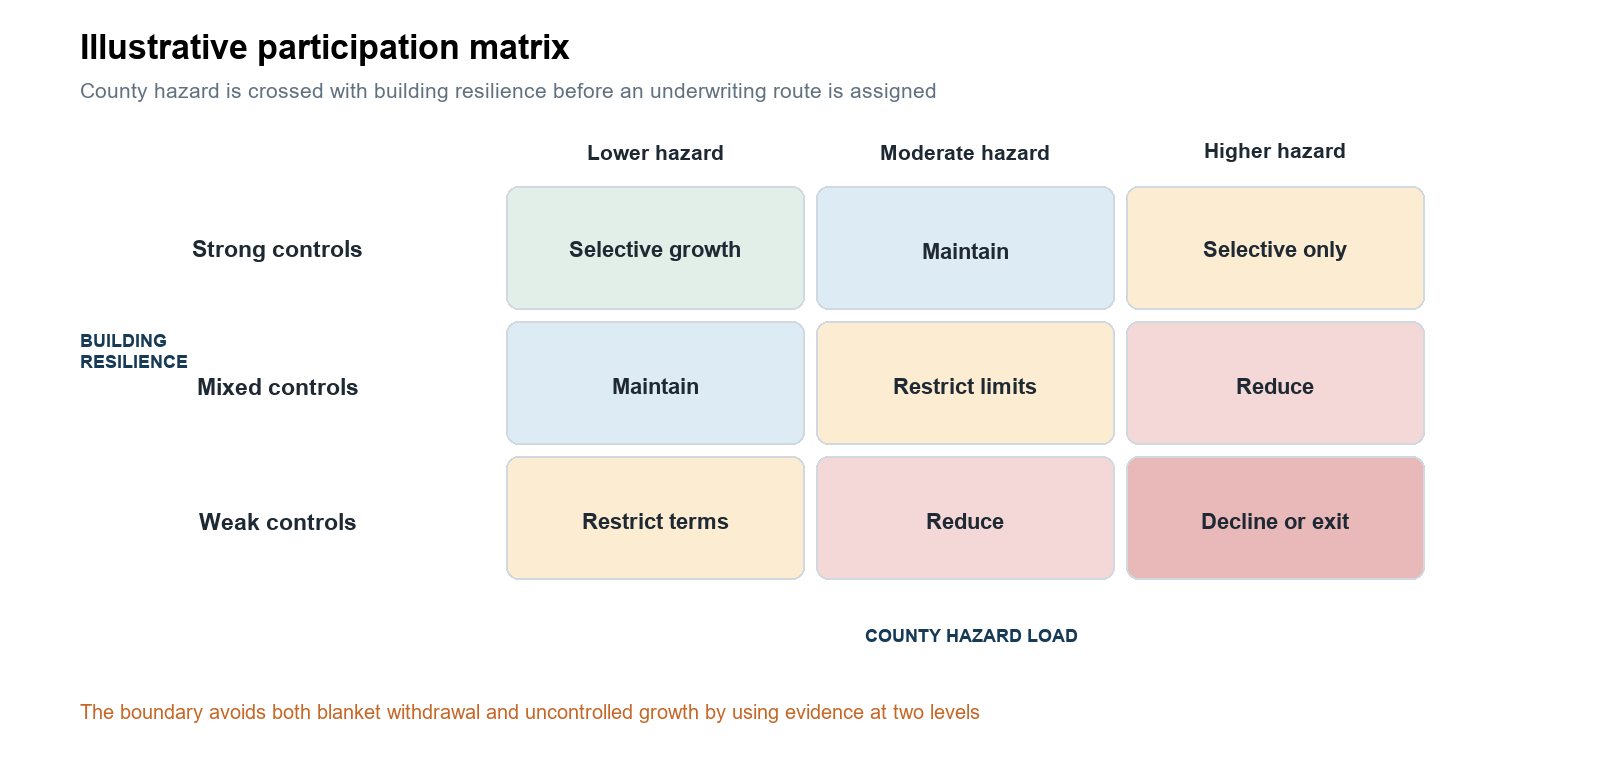
The portfolio is separated by the conditions that change expected loss and capacity consumption. County hazard sets the starting point, while building resilience, terms, rate, claims, concentration and reinsurance determine whether an account can grow, remain, reduce or exit.
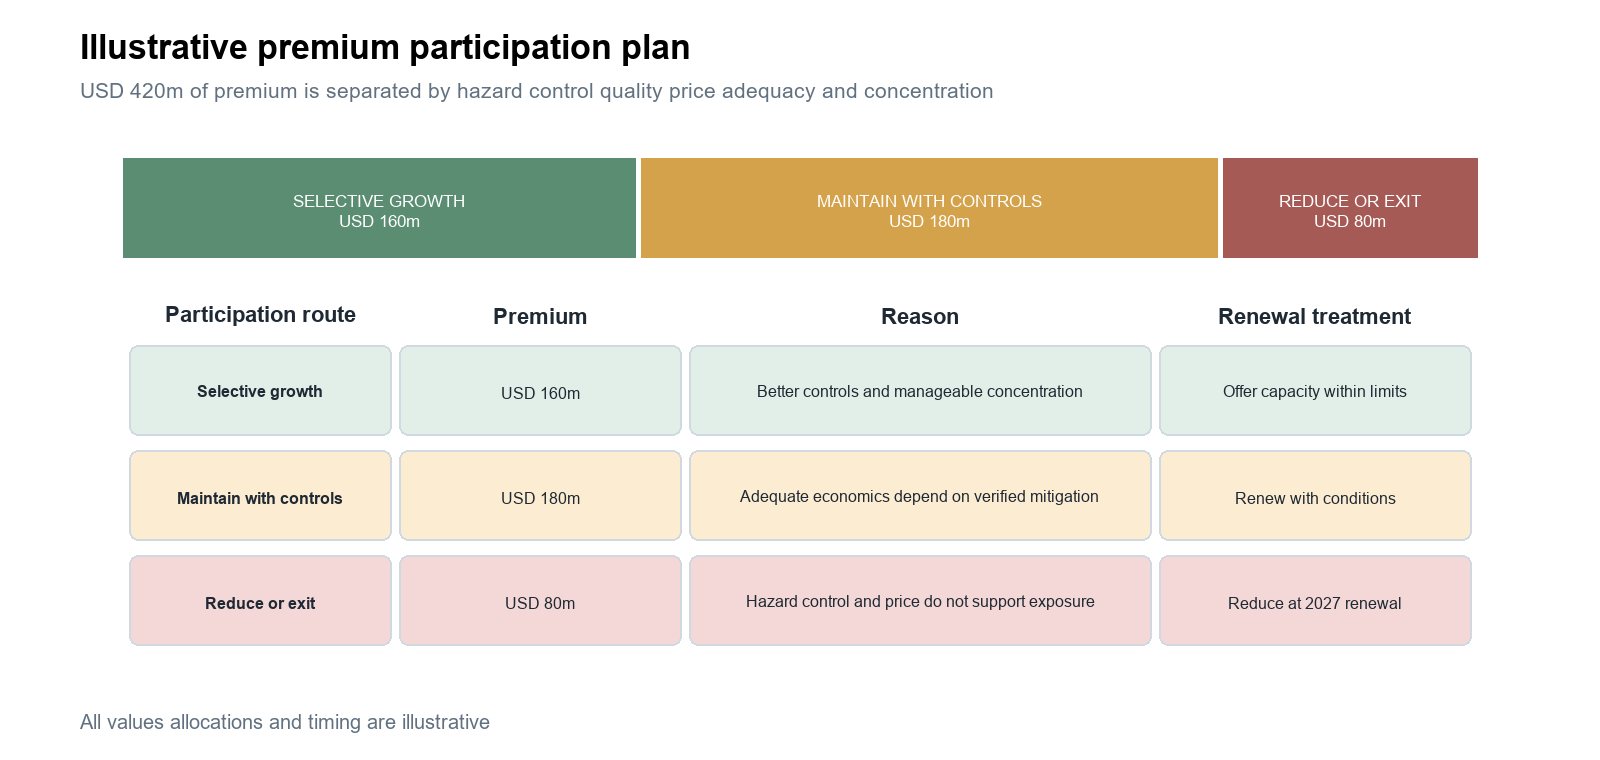
Participation route | Evidence to confirm before release | Management treatment |
|---|---|---|
Selective growth | Verified controls, adequate price, manageable concentration and broker access | Offer capacity within county and archetype limits |
Maintain with controls | Mitigation completion, updated values, deductible and terms that match the risk | Renew conditionally and monitor evidence |
Reduce or exit | High hazard, weak controls, inadequate price or excessive aggregate concentration | Reduce limits, change terms or leave subject to requirements |
The allocation remains provisional until the relevant evidence passes the stated decision threshold.
Decision routes and pressure cases
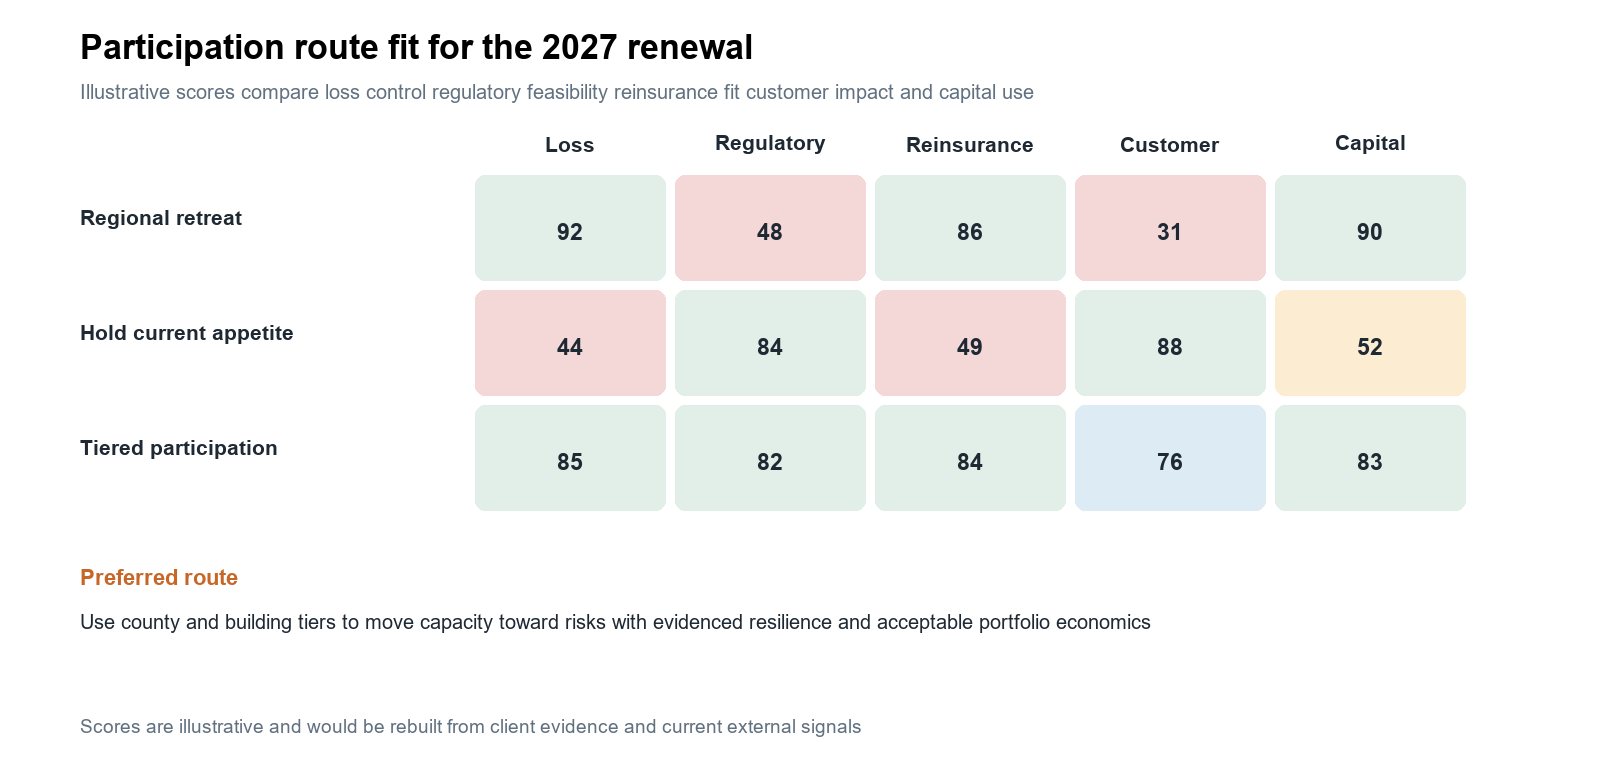
A regional retreat reduces exposure quickly but discards accounts with strong controls and can create regulatory and broker consequences. Holding the current appetite leaves concentration and loss drift unresolved. Tiered participation applies the same evidence rules to growth, maintenance and reduction decisions.
Pressure cases
- Reinsurance attachment rises Recalculate the county and archetype limits and reduce low layer exposure before changing the whole regional appetite.
- Rebuilding cost rises by twelve percent Update insured values, loss estimates and price adequacy before releasing additional capacity.
- A major competitor withdraws Test broker demand and price improvement, but add capacity only where account controls and aggregation remain acceptable.
- Mitigation evidence is incomplete Keep the account in the conditional tier until roof, flood, protection and continuity information is verified.
Recommended strategic decision
Approve tiered participation subject to six implementation gates. Underwriting receives a county and building boundary rather than a single regional instruction. Capacity moves only after account data, price, reinsurance, regulatory and aggregation checks are complete.
Decision gate | Illustrative acceptance condition | Action if unmet |
|---|---|---|
Hazard evidence | County and location peril measures are reconciled with the catastrophe model and recent events | Hold the account route provisional |
Account resilience | Construction, roof, elevation, protection and continuity evidence meet the tier standard | Require inspection or reduce capacity |
Claims and values | Loss history and insured values are current and normalised for the account | Reprice or defer the decision |
Reinsurance fit | The account and aggregate position fit treaty attachment, exclusions and limits | Reduce line size or change structure |
Regulatory route | Required filings, notices, timing and market conduct controls are documented | Delay or change implementation |
Portfolio capacity | The proposed action remains within county, peril and archetype limits after all renewals | Escalate or decline capacity |
What would change the recommendation
Improved mitigation, adequate price and additional reinsurance could move an account or county toward growth. Deteriorating loss, rebuilding cost, treaty terms or concentration would tighten the boundary. A regulatory change could alter implementation without changing the underlying risk view.
Decision control plan
Management would review hazard updates, claims, rebuilding cost, insured values, mitigation evidence, filings, competitor capacity, broker submissions, reinsurance terms and aggregate exposure. The control plan would separate changes in risk from changes in implementation feasibility.
First one hundred and twenty days
- Fix the portfolio perimeter Reconcile locations, counties, building archetypes, premium, limits, claims and treaty treatment.
- Build the participation boundary Combine hazard, account resilience, price adequacy, regulation and concentration using consistent definitions.
- Reconstruct market behaviour Review public filings, broker evidence and competitor capacity without treating quoted appetite as bound exposure.
- Test the renewal book Apply the proposed tiers to account and county cohorts and measure premium, limit and aggregate consequences.
- Issue the 2027 decision Approve tier rules, exceptions, authority levels and monitoring triggers before renewal execution.
What August Research would deliver
- Participation evidence lattice A source linked view of hazard, accounts, regulation, reinsurance and market behaviour.
- County and building matrix Clear rules for growth, maintenance, reduction and exit.
- Portfolio reallocation Premium and aggregate limit effects by county, peril and building archetype.
- Renewal pressure test Loss, cost, reinsurance and competitor cases with decision breakpoints.
- Decision control plan Indicators, owners and exception rules for the renewal cycle.
Scope boundary
This illustration demonstrates secondary research and portfolio decision analysis. It does not replace actuarial pricing, catastrophe modelling, individual underwriting, legal or regulatory advice, rate and form filing, reinsurance placement, capital modelling or policyholder communication.
The client, products, customers, competitors, projects, assets, financial values, scores, thresholds and recommendation are hypothetical. Official sources are included to demonstrate the evidence routes an engagement would use.