PHASE 2 ILLUSTRATION 1 SPECIALTY CHEMICALS
Strategic Business Intelligence PFAS Free Industrial Coatings
An illustrative decision case for a European coatings producer evaluating the timing and scale of portfolio reformulation
DECISION
PORTFOLIO
EXPOSURE
PLANNING HORIZON
Staged reformulation
12 formulations
EUR 48m revenue
2026 to 2029
Decision question
Should the company release a EUR 14 million reformulation and customer-qualification programme before the EU-wide PFAS restriction process is complete, and how should the twelve potentially affected formulations be sequenced?
Illustrative recommendation
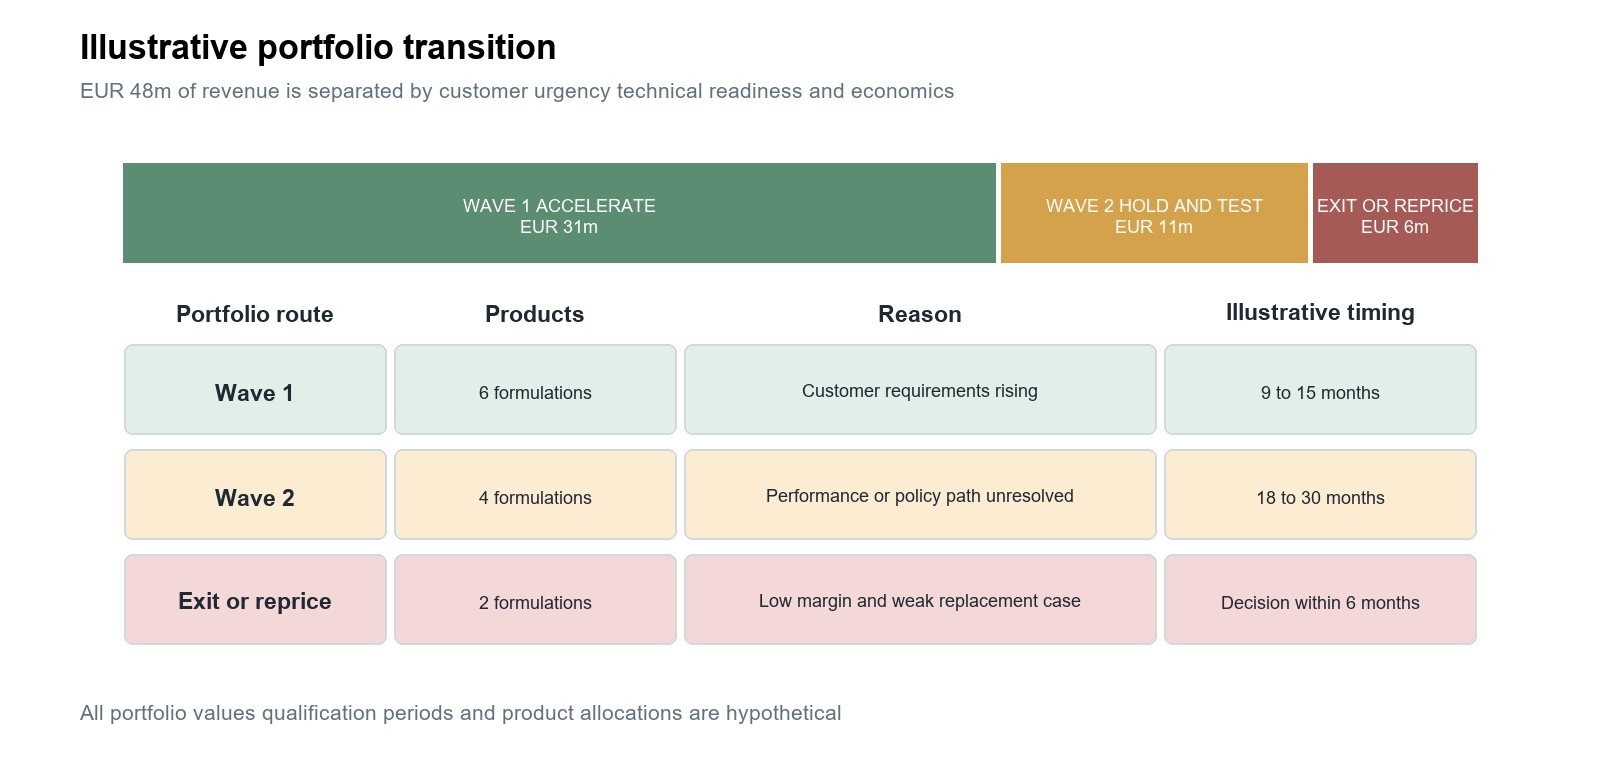
Use a staged dual-track programme rather than waiting for final regulation or accelerating every formulation immediately. Release the first capital gate for six products representing EUR 31 million of annual revenue where customer requirements are tightening and replacement performance appears achievable. Maintain four specialised products under controlled monitoring while technical and policy uncertainty remains. Prepare to exit or reprice two low-margin products if qualification economics do not improve.
The hypothetical client is a European producer of industrial protective and functional coatings. Twelve formulations representing EUR 48 million of annual revenue contain intentionally added fluorinated substances or depend on fluorinated process aids. All client, customer, competitor, product, commercial and scoring values in this document are illustrative.
Decision Evidence Lattice
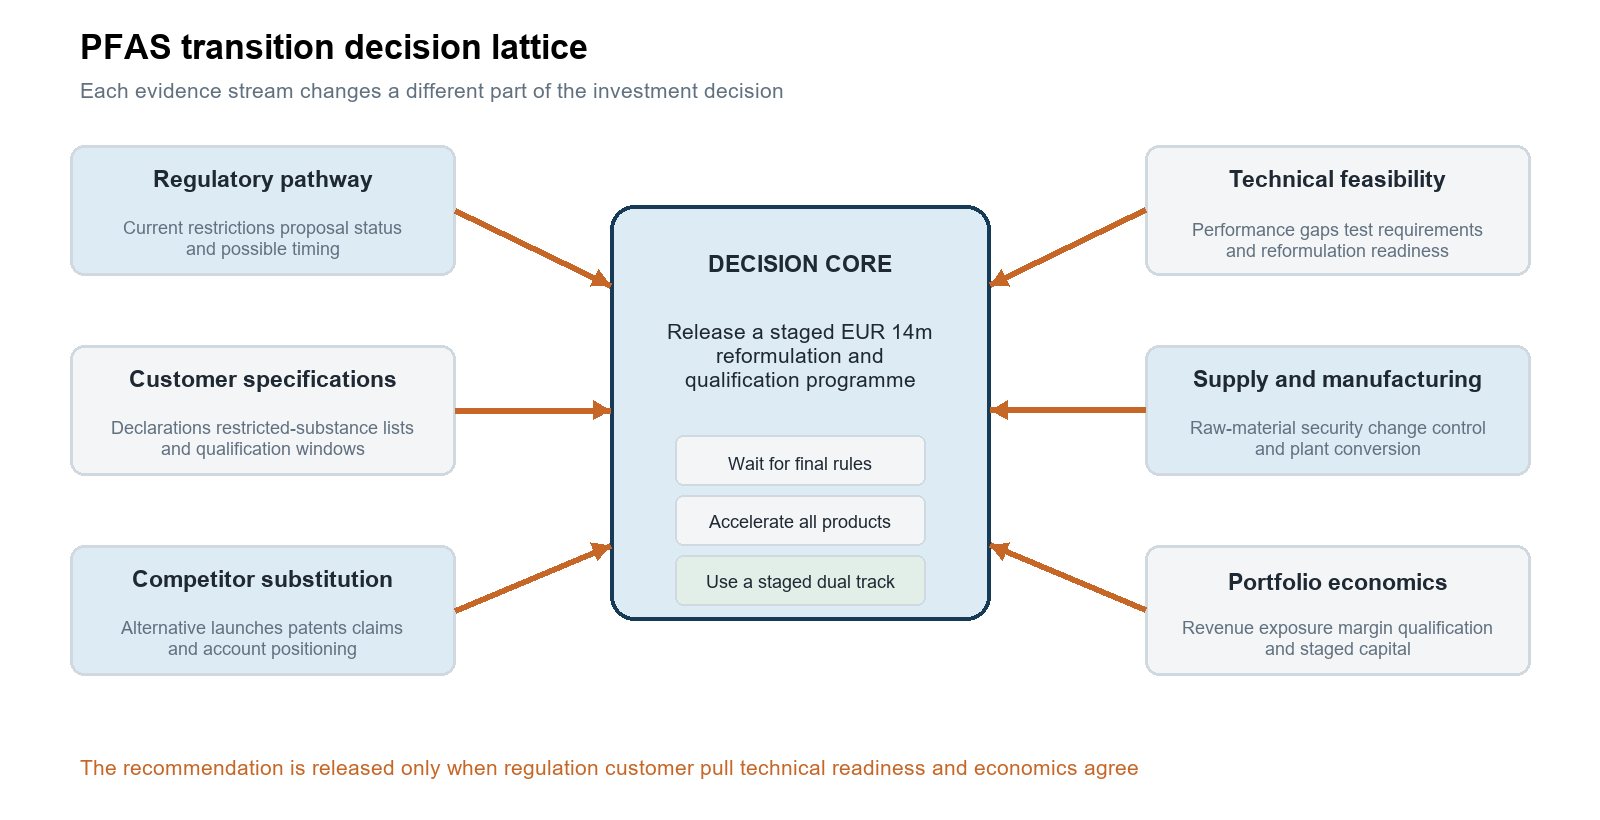
The decision cannot be resolved by the regulatory timeline alone. Customer specifications may tighten before legislation is final, while full acceleration may destroy value if technically suitable substitutes are not ready. The lattice connects the six evidence streams that determine when capital should be released and which products should move first.
Decision condition | Illustrative interpretation | Effect on the route |
|---|---|---|
Customer clock | Seven of fifteen tracked account programmes request fluorine-free alternatives or fuller substance declarations | Begin qualification before a final legal deadline is known |
Technical readiness | Six products have candidate replacements with no unresolved critical performance failure | Prioritise these products for the first capital gate |
Portfolio exposure | EUR 31 million of the EUR 48 million exposure is concentrated in products with rising customer pressure | Do not spread investment equally across the portfolio |
Policy uncertainty | The universal restriction remains in the REACH process | Preserve technical and capital flexibility for specialised uses |
Signal chronology and evidence architecture
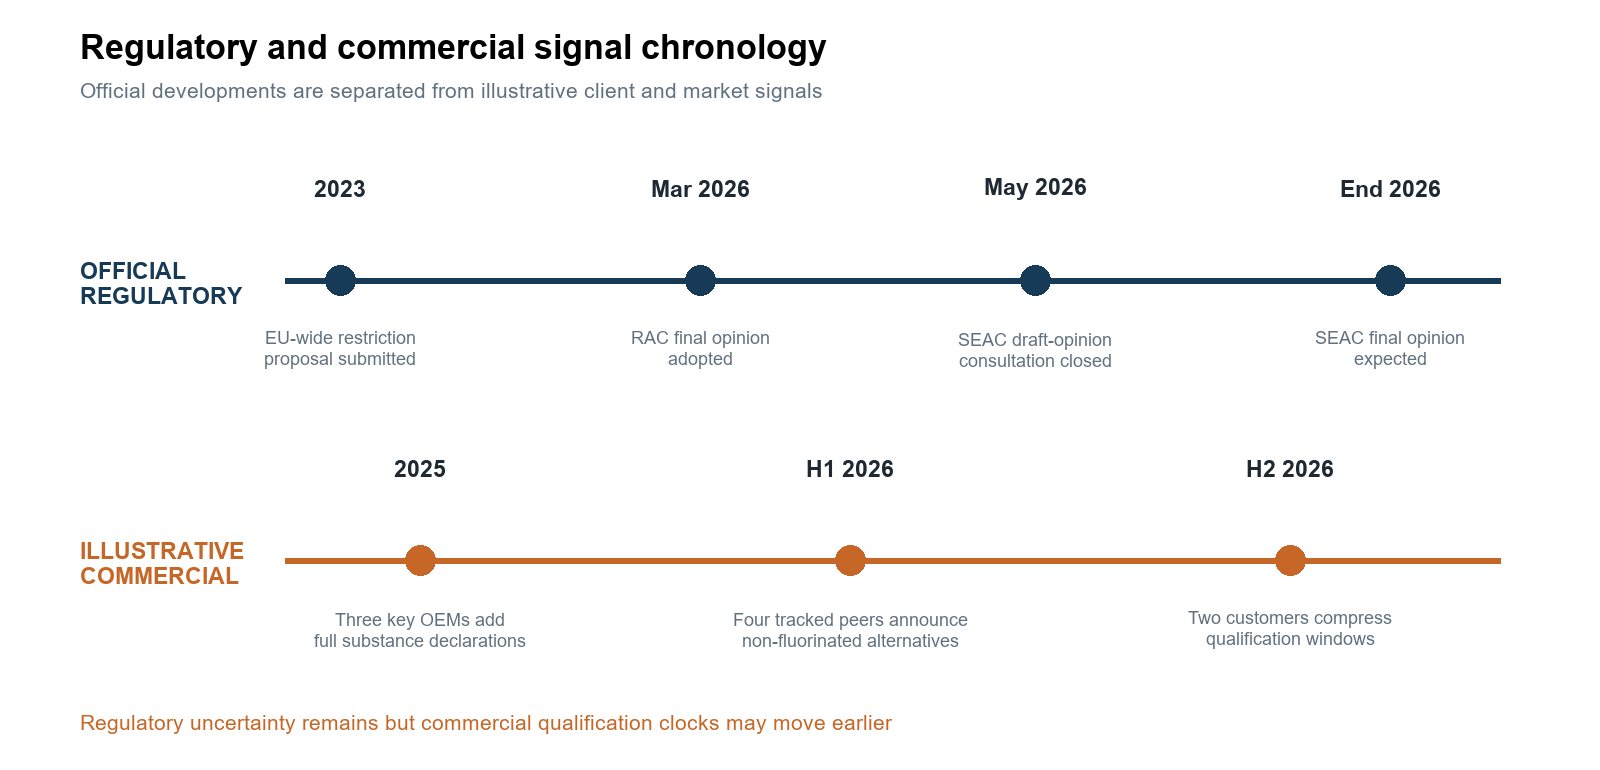
As of September 2026, ECHA's Risk Assessment Committee has adopted its final opinion on the EU-wide PFAS restriction proposal. The consultation on the Socio-Economic Analysis Committee's draft opinion closed in May 2026, and ECHA states that the final SEAC opinion is expected by the end of 2026. The Commission process follows the ECHA opinions. The illustration therefore separates confirmed regulatory steps from hypothetical commercial signals.
Evidence stream | Representative source route | Decision use |
|---|---|---|
Regulation | ECHA PFAS topic and committee opinions, EUR-Lex REACH restrictions and national enforcement guidance | Distinguish current law, committee opinion, proposal, possible derogation and expected next step |
Customer requirements | Client-supplied specifications, public restricted-substance lists, procurement documents and product declarations | Establish which accounts require change, when qualification must begin and what evidence they expect |
Competitor and technology | Product documentation, patents through EPO Espacenet and WIPO PATENTSCOPE, filings, launches and hiring | Identify credible alternatives, capability investment and the difference between claims and qualified performance |
Market and economics | Eurostat PRODCOM and Comext, supplier documentation, company disclosures and client revenue and cost records | Size the exposed portfolio, test supply options and build product-level transition economics |
Portfolio exposure and transition sequence
The analysis does not classify every fluorinated use as equally urgent. Products are separated by customer pressure, technical substitution readiness, qualification time, margin, manufacturing change and the consequences of losing the current performance profile.
Portfolio route | Evidence to confirm before release | Management treatment |
|---|---|---|
Wave 1 accelerate | Customer timing, candidate chemistry, critical performance tests, supplier availability and product-level margin | Release formulation and qualification funding in the first capital gate |
Wave 2 hold and test | Use-specific policy treatment, performance gap, customer tolerance, volume concentration and alternative supply | Continue controlled supply while testing replacements and policy scenarios |
Exit or reprice | Account dependence, replacement economics, contract obligations and cost of maintaining a declining niche | Prepare customer migration, price recovery or orderly withdrawal |
Product placement is provisional. The route changes if a customer specification, technical test, supplier position or regulatory development crosses the agreed decision threshold.
Investment routes and pressure cases
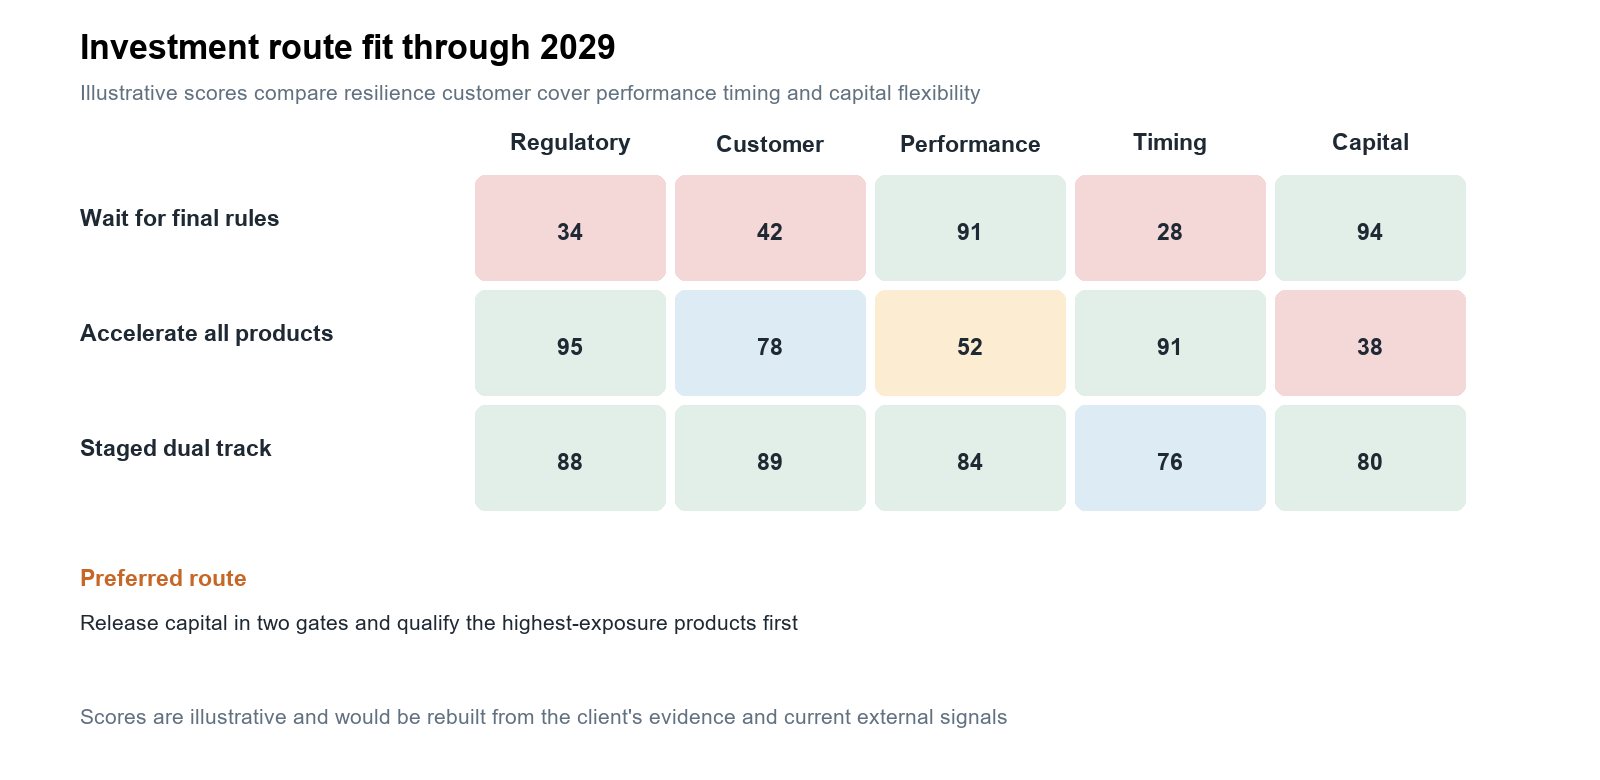
Waiting protects near-term capital but leaves the company exposed to customer qualification clocks and a compressed later transition. Full acceleration improves regulatory readiness but can force immature substitutes into demanding applications. A staged dual track preserves the current performance base while moving the products with the strongest combined case.
Pressure cases
- The final restriction is later or narrower Keep Wave 1 focused on customer-led value and defer specialised products that do not yet justify conversion.
- Customer requirements advance by twelve months Move qualified Wave 1 accounts forward and fund application testing before final process milestones are known.
- Replacement raw-material cost rises by eighteen percent Rebuild product margins, redesign formulations and use price recovery or exit where the customer value cannot absorb the increase.
- Qualification takes nine months longer Protect current supply, sequence customer programmes and prevent the pilot from becoming a portfolio-wide launch commitment.
Recommended strategic decision
Approve the staged dual-track programme subject to six gates. The recommendation authorises a controlled evidence and qualification programme, not an irreversible portfolio conversion. The second capital release depends on customer acceptance, critical performance results, supplier readiness and updated regulatory interpretation.
Decision gate | Illustrative acceptance condition | Action if unmet |
|---|---|---|
Substance and use map | All twelve formulations mapped to substances, function, volume, supply and use-specific regulatory treatment | Do not assign a product route |
Customer clock | Specifications and qualification timing confirmed for accounts representing at least eighty-five percent of exposed revenue | Keep the route provisional and narrow the first wave |
Performance threshold | Wave 1 candidates meet the defined minimum across critical chemical, thermal, adhesion and durability tests | Return the product to Wave 2 or redesign |
Supply readiness | Qualified alternative suppliers and manufacturing change controls support the intended launch sequence | Delay customer qualification commitments |
Transition economics | Product margin dilution remains within the approved threshold after material, testing and change costs | Reprice, redesign, reduce scope or exit |
Capital stage | The first EUR 5 million gate produces the evidence required before the remaining EUR 9 million is released | Stop the programme at the reversible gate |
What would change the recommendation
A substantial narrowing of regulatory exposure, weak customer demand for alternatives, unresolved failure on critical performance, unavailable replacement supply or product economics that cannot recover the conversion cost would reduce or defer the programme. Faster customer deadlines, credible peer substitution and successful Wave 1 qualification would support earlier release of the second capital gate.
Decision control plan
Management would review ECHA and Commission milestones, customer specification changes, account qualification dates, competitor alternative claims, patent and hiring signals, critical test results, supplier capacity, product margin and capital consumed. Each indicator would have an owner, review frequency and defined action threshold.
First one hundred and twenty days
- Fix the decision boundary Confirm the twelve formulations, intended uses, EU markets, customer programmes, investment horizon and conditions that would stop the programme.
- Build the source-linked use map Connect substance identity and function with regulatory status, annual volume, suppliers, manufacturing sites, products and customer uses.
- Reconstruct the customer clock Review available specifications, restricted-substance lists, tenders and qualification requirements for the accounts carrying the greatest exposure.
- Test the alternative pathways Compare candidate chemistries, patent and product evidence, critical performance requirements, supplier readiness and likely qualification time.
- Issue the first capital decision Assign each product to accelerate, hold and test, or exit and reprice, then define the evidence required for the second funding gate.
What August Research would deliver
- Decision evidence lattice A source-linked view of regulation, customers, competitors, technical readiness, supply and portfolio economics.
- Signal chronology Confirmed developments, expected process milestones, commercial signals and the implication of their timing.
- Portfolio transition map Product and revenue exposure, transition wave, qualification sequence and unresolved evidence.
- Investment pressure test Alternative routes, adverse conditions, breakpoints and the reasons for the selected capital sequence.
- Decision control plan Indicators, owners, review frequency and action triggers for accelerating, holding, redesigning or stopping.
Scope boundary
This illustration demonstrates secondary research and strategic decision analysis. It does not replace legal advice, substance testing, toxicology, formal REACH interpretation, product certification, customer qualification, formulation development, plant engineering or supplier diligence.
The client, formulations, customers, competitors, revenue, costs, scores, thresholds and recommendation are hypothetical. Regulatory milestones are included to show how an actual engagement would use official evidence current at the date of the decision.