PHASE 2 ILLUSTRATION 5 MARITIME SERVICES
Strategic Business Intelligence Maritime Service Network
An illustrative decision case for a maritime service provider repositioning its network around fuel rules fleet change and route volatility
DECISION
FOOTPRINT
PROGRAMME
HORIZON
Two hub network
6 ports
EUR 18m
2026 to 2030
Decision question
Should the company invest EUR 18 million in low carbon fuel readiness, retrofit support and voyage performance services across six European ports, and which locations should carry fixed capability versus mobile or partner coverage?
Illustrative recommendation
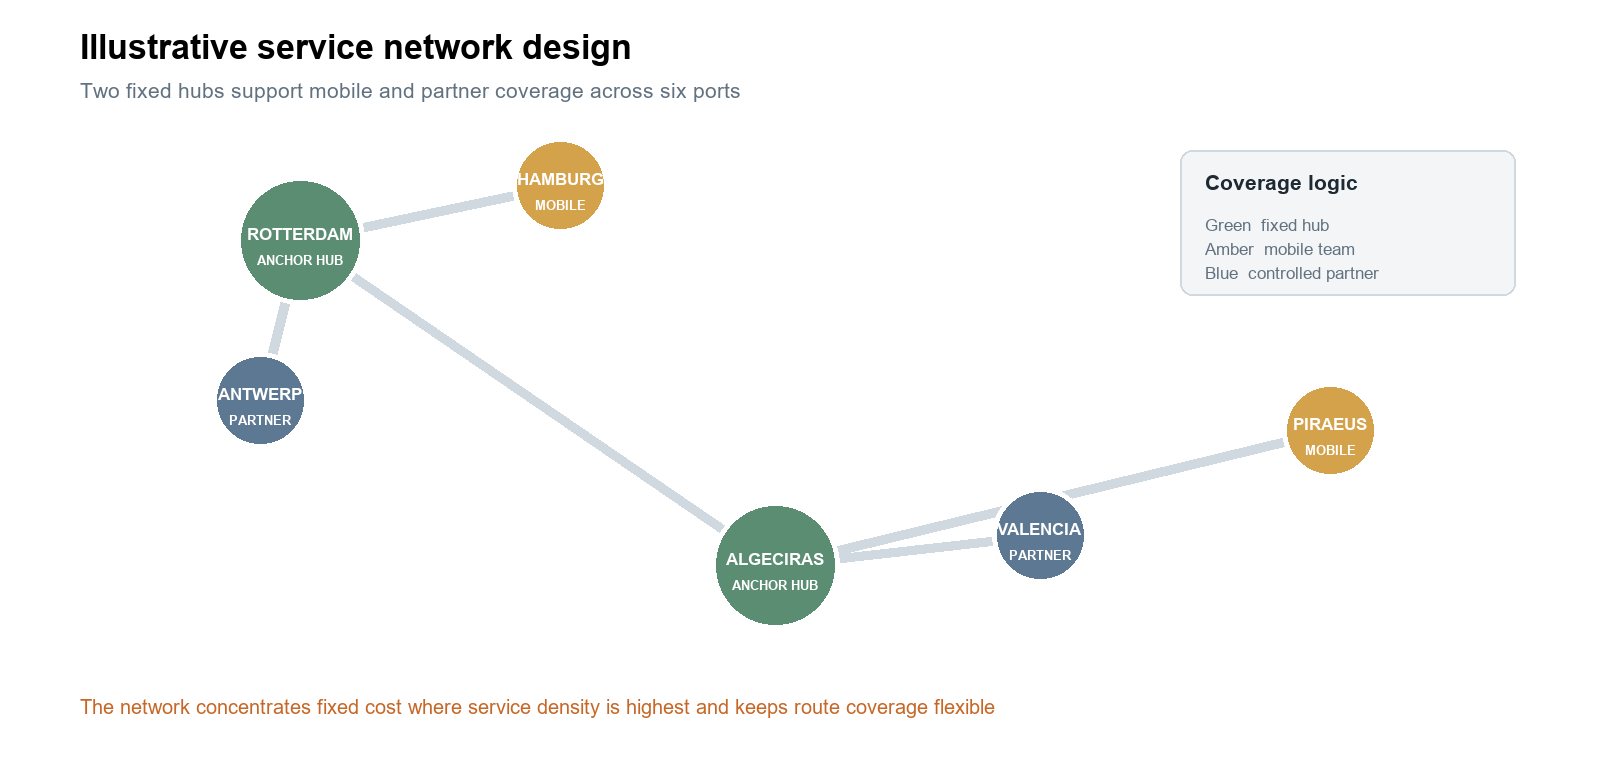
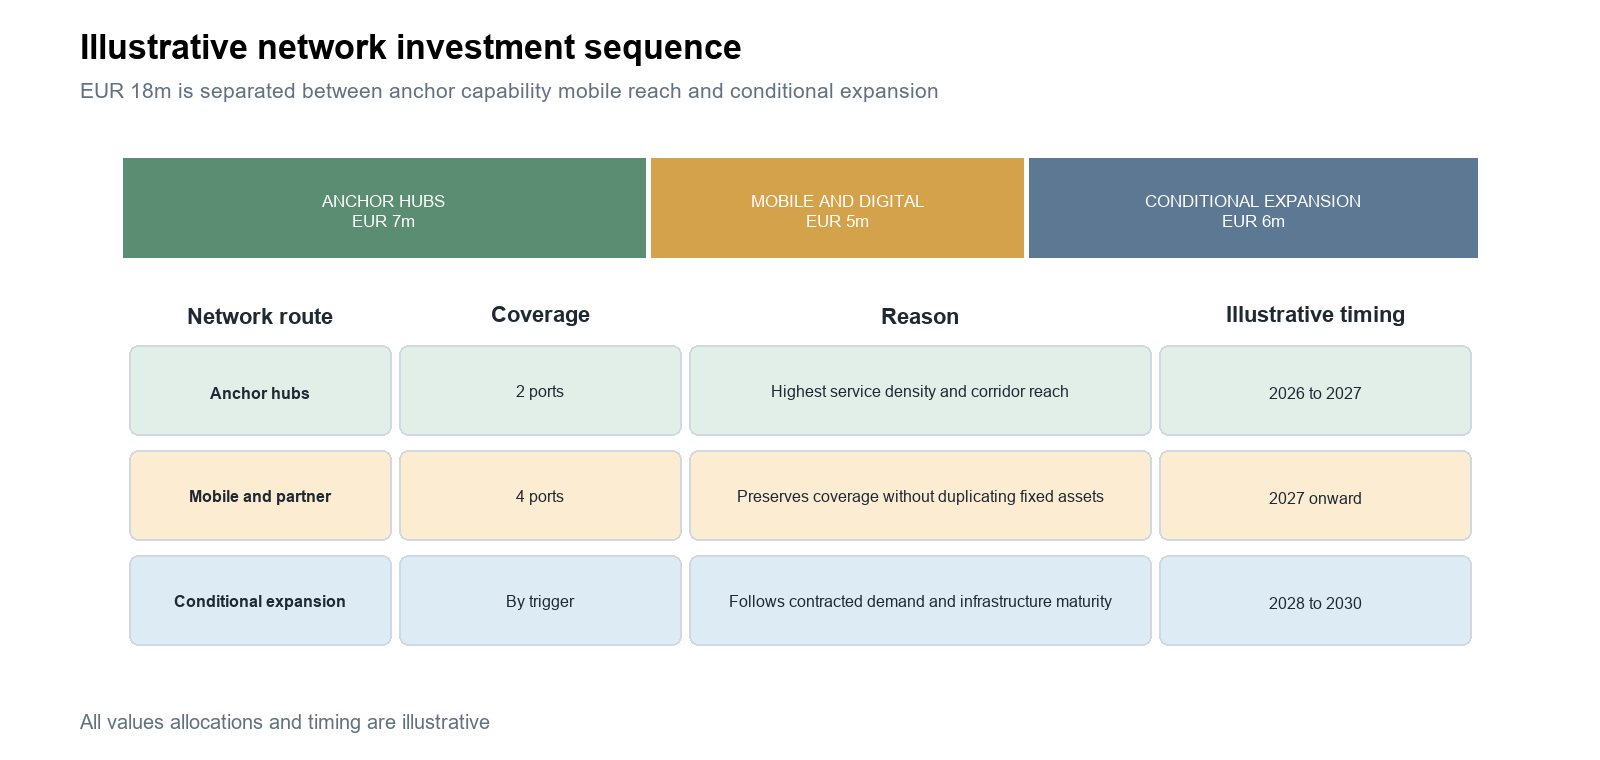
Build fixed technical and spares capability in Rotterdam and Algeciras, supported by mobile teams and selected partners across Antwerp, Hamburg, Valencia and Piraeus. Release EUR 7 million for the two anchor hubs and service systems. Release the remaining EUR 11 million only when contracted vessel demand, technician utilisation and port infrastructure evidence justify expansion.
The hypothetical client provides technical, maintenance and compliance support to container, tanker and bulk fleets. Its network handles about twelve hundred service calls a year across six European ports. All client, vessel, customer, competitor, port, financial and scoring values are illustrative.
Decision Evidence Lattice
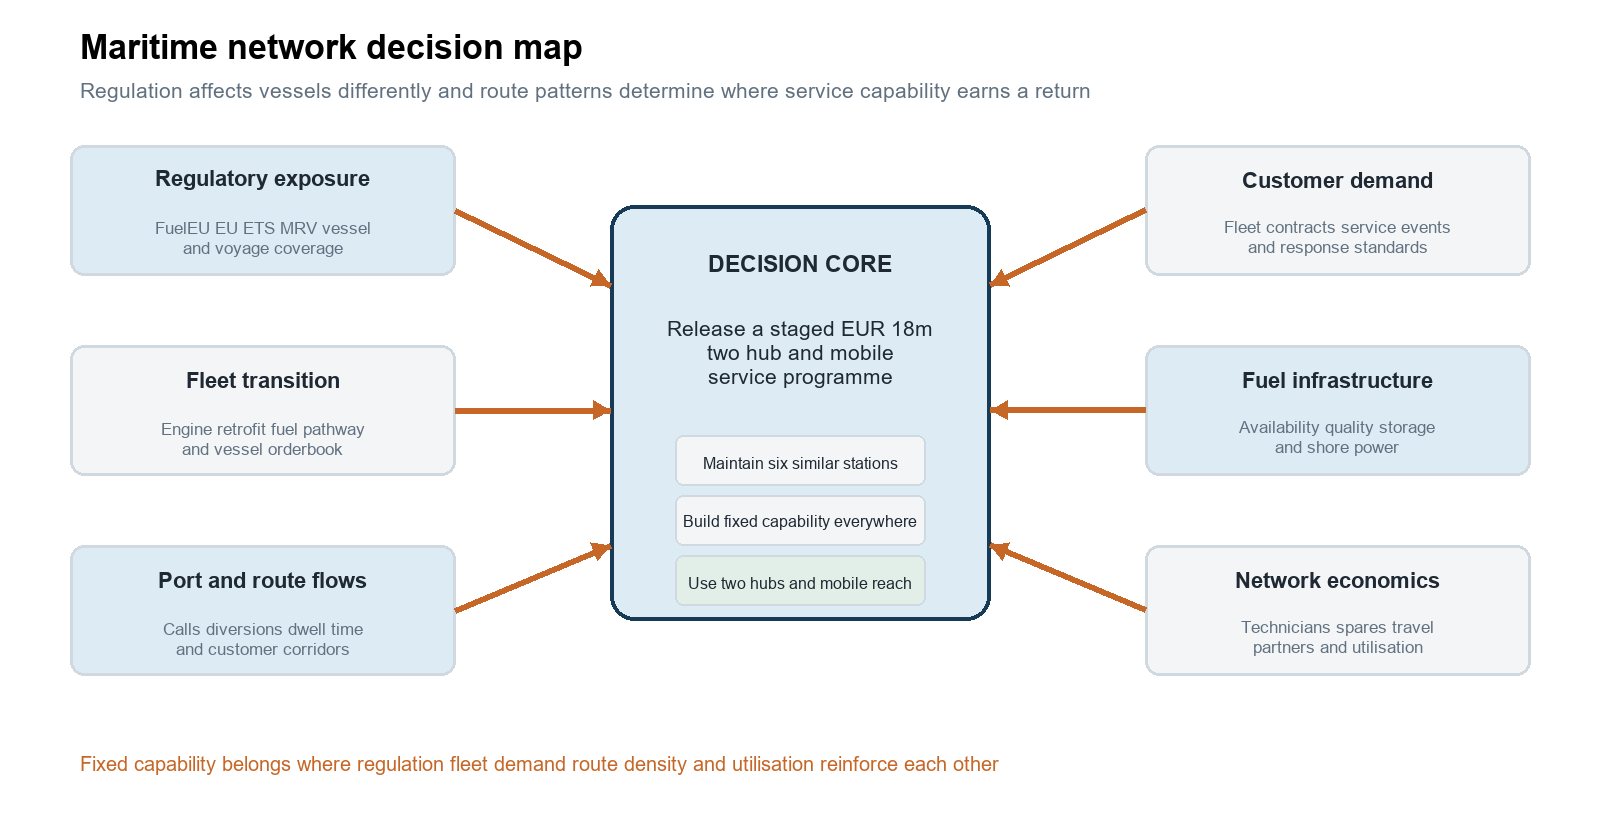
A rule affecting a ship does not automatically create demand in every port. Vessel type, route, fuel strategy, retrofit schedule, customer contract and local infrastructure determine where the service event occurs. The decision map connects those signals to fixed, mobile and partner coverage.
Decision condition | Illustrative interpretation | Effect on the route |
|---|---|---|
Regulatory workload | FuelEU and EU ETS increase measurement, fuel and emissions related requirements for covered operations | Build the service offer around actual vessel and voyage coverage |
Customer concentration | Eight fleet accounts create sixty four percent of the illustrative opportunity around two route clusters | Place fixed capability near the contracted demand |
Service density | Rotterdam and Algeciras provide the strongest combined call density, technician use and corridor reach | Use them as anchor hubs rather than replicating all assets |
Technology uncertainty | Fuel and retrofit pathways remain mixed across the served fleet | Keep tools, training and partner choices modular |
Signal interpretation and source architecture
FuelEU Maritime has applied since 1 January 2025. Maritime EU ETS obligations phase to full coverage of reported 2026 emissions, while methane and nitrous oxide enter ETS scope from 2026. The case uses those official milestones together with hypothetical fleet, route and customer evidence.
Evidence stream | Representative source route | Decision use |
|---|---|---|
Regulation | European Commission FuelEU Maritime and EU ETS guidance, EUR Lex, EMSA THETIS MRV and national maritime authorities | Confirm ship, voyage, fuel, reporting and surrender obligations and implementation timing |
Fleet and technology | IMO GISIS and DCS material, Equasis, classification society rules, vessel databases, orderbooks and retrofit announcements | Map the served fleet, technical pathway and probable service events |
Ports and routes | Eurostat maritime statistics, port authority calls and infrastructure plans, AIS derived flows and carrier schedules | Measure corridor density, diversions, dwell and infrastructure readiness |
Customers and competitors | Client service records and contracts, fleet disclosures, tenders, competitor locations, technician hiring and partner announcements | Estimate demand, response needs, capacity and achievable utilisation |
Portfolio allocation and transition sequence
The programme separates capability that must be fixed from capability that can travel or be provided through a partner. The location decision uses vessel calls, customer contracts, technician utilisation, spares demand, fuel and shore power infrastructure, route volatility and response time.
Network route | Evidence to confirm before release | Management treatment |
|---|---|---|
Rotterdam and Algeciras | Fleet account density, technical demand, technician supply, spares flow and corridor reach | Build fixed technical and inventory capability |
Mobile and partner ports | Response time, repeat demand, partner quality and travel economics | Provide scheduled mobile coverage with controlled partner standards |
Conditional expansion | Contracted calls, utilisation, port infrastructure, fuel pathway and customer service commitments | Add fixed capability only after the trigger is met |
The allocation remains provisional until the relevant evidence passes the stated decision threshold.
Decision routes and pressure cases
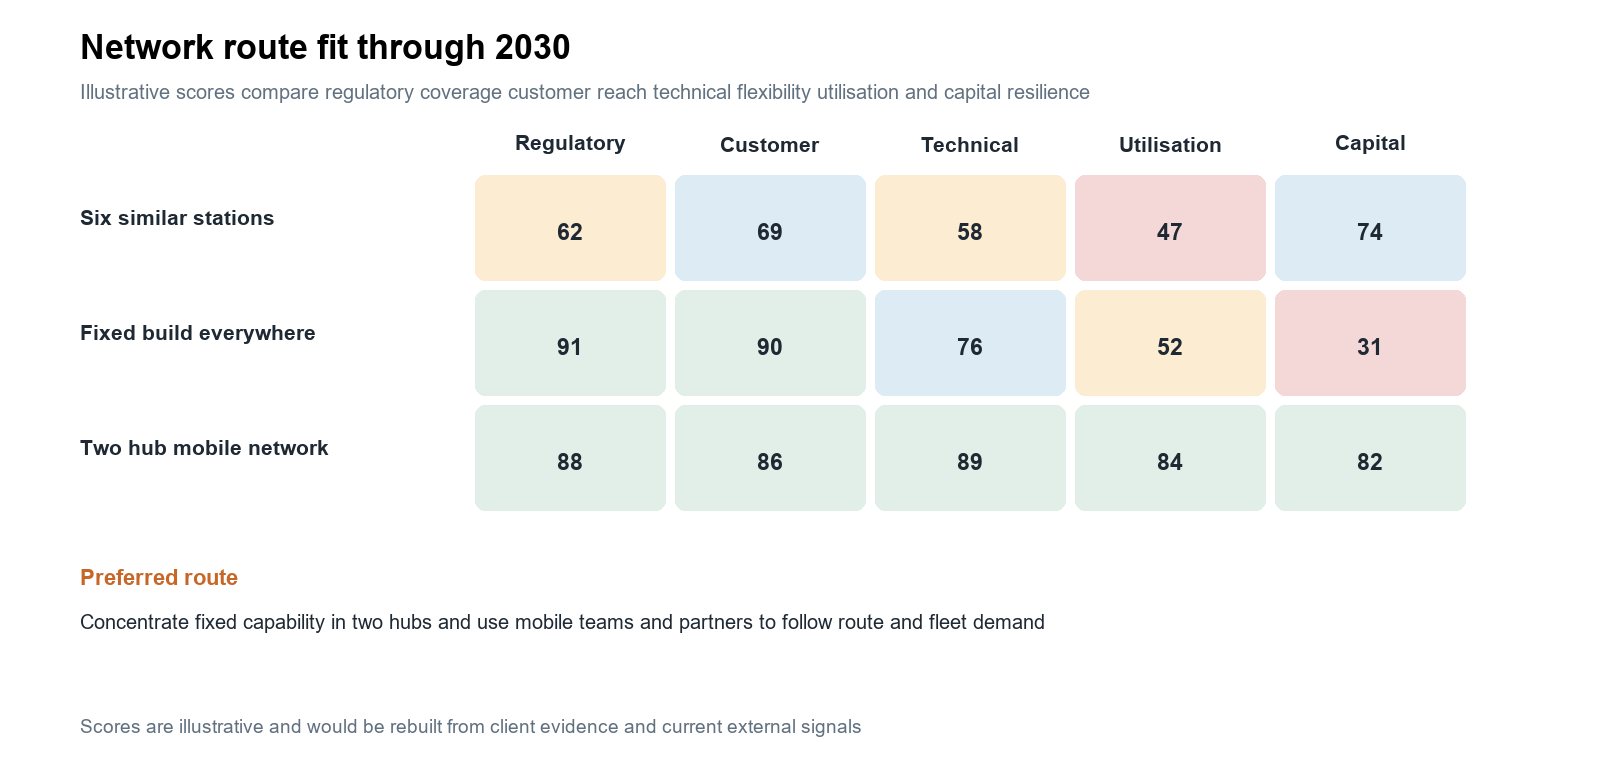
Maintaining six similar stations leaves capability too shallow for new technical needs. Building fixed assets everywhere covers more possibilities but creates poor utilisation while fuel and route choices remain unsettled. A two hub network provides specialist depth and preserves flexible coverage.
Pressure cases
- A route diverts away from an anchor hub Move mobile coverage and spares while keeping fixed expansion conditional on sustained calls rather than a short disruption.
- One fuel pathway gains faster adoption Increase training, tools and supplier agreements for the affected vessel cohort without redesigning the entire network.
- Technician utilisation remains below sixty percent Limit recruitment, widen mobile coverage or use a partner before adding fixed stations.
- A fleet customer offers a multi port contract Test volume, response, margin and corridor fit and use the contract as evidence for the second capital gate.
Recommended strategic decision
Approve the two hub and mobile network subject to six gates. The first release builds specialist capability, spares logic, field systems and customer coverage around Rotterdam and Algeciras. Further fixed locations depend on contracted demand and measured utilisation.
Decision gate | Illustrative acceptance condition | Action if unmet |
|---|---|---|
Vessel coverage | Target vessels and voyages are mapped to the relevant regulatory and technical requirements | Do not size the service offer |
Contracted demand | Named fleets support the first wave call and service assumptions | Reduce fixed capacity |
Port fit | Infrastructure, access, suppliers and operating conditions support the planned services | Use mobile or partner coverage |
Technical readiness | Tools, training, spares, safety procedures and class requirements are complete | Narrow the service scope |
Utilisation economics | Technician and inventory use meet the defined margin and response thresholds | Change staffing or location |
Capital stage | The EUR 7 million gate produces evidence needed before the remaining EUR 11 million is released | Stop at the reversible gate |
What would change the recommendation
Sustained route diversion, weak fleet commitment, low technician utilisation or delayed infrastructure would defer expansion. Multi port customer contracts, repeat service demand and clearer fleet technology choices would support additional fixed capability.
Decision control plan
Management would review regulatory guidance, covered fleet, vessel orders and retrofits, port calls, route changes, customer contracts, service events, response times, technician utilisation, spares turns, infrastructure projects, competitor capacity and capital consumed.
First one hundred and twenty days
- Fix the vessel and route universe Reconcile customer fleets, vessel characteristics, covered voyages, port calls and service history.
- Build the regulatory service map Connect FuelEU, EU ETS and MRV requirements with vessel cohorts and service tasks.
- Measure network density Compare calls, contracts, technician time, spares movement, response and partner capability across the six ports.
- Test the operating routes Compare six stations, full build and two hub alternatives under route, fuel and utilisation pressure cases.
- Issue the first capital decision Approve anchor capability and define the contract and utilisation evidence needed for expansion.
What August Research would deliver
- Vessel and route evidence lattice A source linked view of regulation, fleets, ports, customers and network economics.
- Service network map Fixed, mobile and partner coverage tied to demand and response requirements.
- Investment sequence Capability, staffing and inventory assigned to capital gates and port triggers.
- Network pressure test Route, fuel, contract and utilisation cases with expansion breakpoints.
- Decision control plan Indicators and actions for adding, moving, partnering or stopping capacity.
Scope boundary
This illustration demonstrates secondary research and strategic decision analysis. It does not replace legal or regulatory advice, emissions verification, vessel engineering, class approval, fuel safety assessment, port contracting, labour planning, inventory design or customer contracting.
The client, products, customers, competitors, projects, assets, financial values, scores, thresholds and recommendation are hypothetical. Official sources are included to demonstrate the evidence routes an engagement would use.