ELECTRIC UTILITIES | UNITED STATES
Locating the constraints behind transformer availability
A Critical Component Capacity Stack for a multi-state grid programme
CLIENT DECISION Which component and facility bottlenecks are extending distribution-transformer availability, and where can procurement action change the schedule?
Background
A utility group planning replacement and grid-expansion work needed to distinguish market-wide lead-time commentary from the specific constraints affecting its transformer classes. The decision was how to sequence orders, specifications and supplier development across a 30-month programme.
1,480
PLANNED UNITS
30
PROGRAMME MONTHS
31
PLANTS REVIEWED
11
COMPATIBLE FACILITIES
ILLUSTRATIVE ENGAGEMENT | The organisation, scope, figures, findings and conclusion below show how the service can be applied. They do not describe an actual client engagement.
RESEARCH DESIGN
Critical Component Capacity Stack
Demand was translated into transformer classes and then into component requirements. For each class, the model layered effective plant capacity, material allocation, production constraints, specification compatibility and committed demand to reveal the first binding bottleneck.
01
Segment unit demand
Separate pole-mounted, pad-mounted and higher-capacity requirements.
02
Decompose the build
Map electrical steel, cores, windings, tanks, bushings and labour dependencies.
03
Screen compatible plants
Apply voltage, efficiency, certification, size and delivery constraints.
04
Stack effective capacity
Adjust nominal output for allocation, changeovers, labour and committed orders.
05
Sequence procurement
Match order timing and specification choices to the binding constraint.
Evidence assembled
- energy and trade statistics
- public procurement and utility filings
- client specifications and project demand
INDEPENDENT VALUE A common evidence structure reconciles internal records with external entity, facility, trade, capacity and event evidence. Assumptions that cannot be confirmed remain visible rather than being converted into false precision.
DEPENDENCY FINDING
Plant count overstated the capacity available to the programme
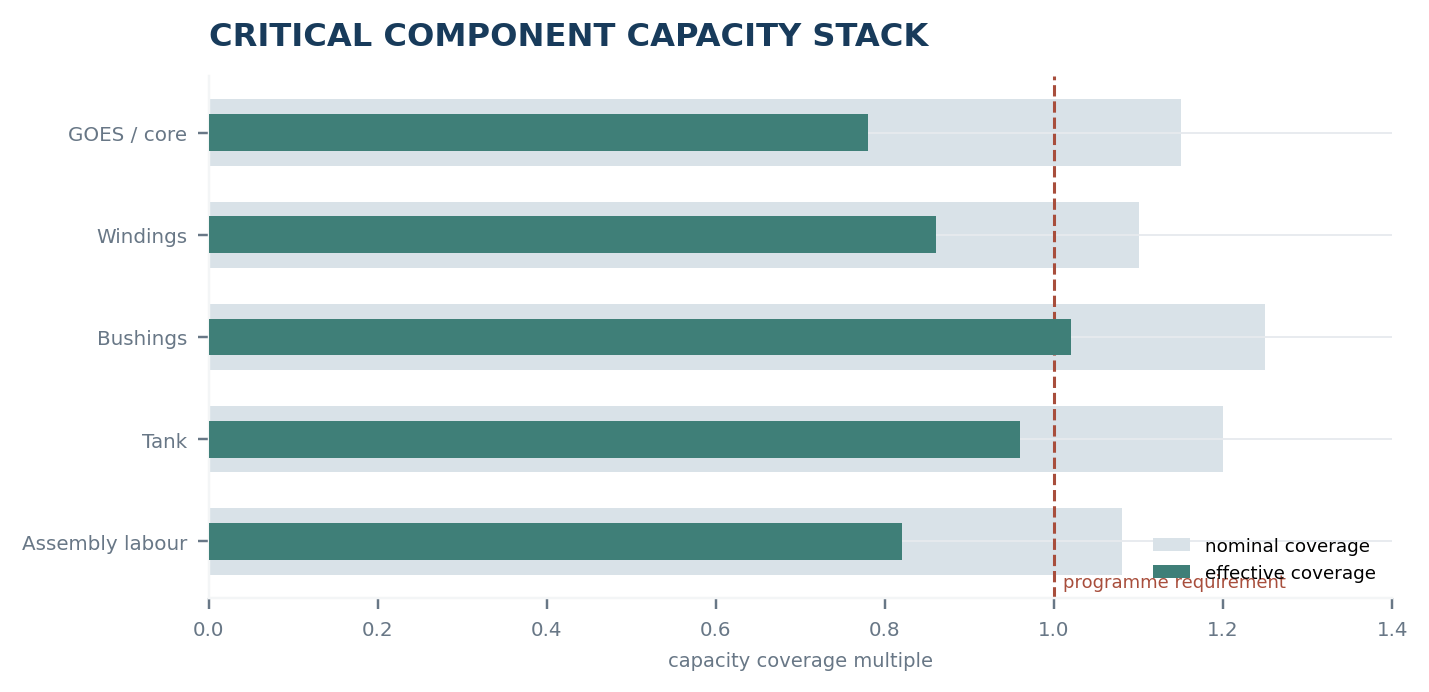
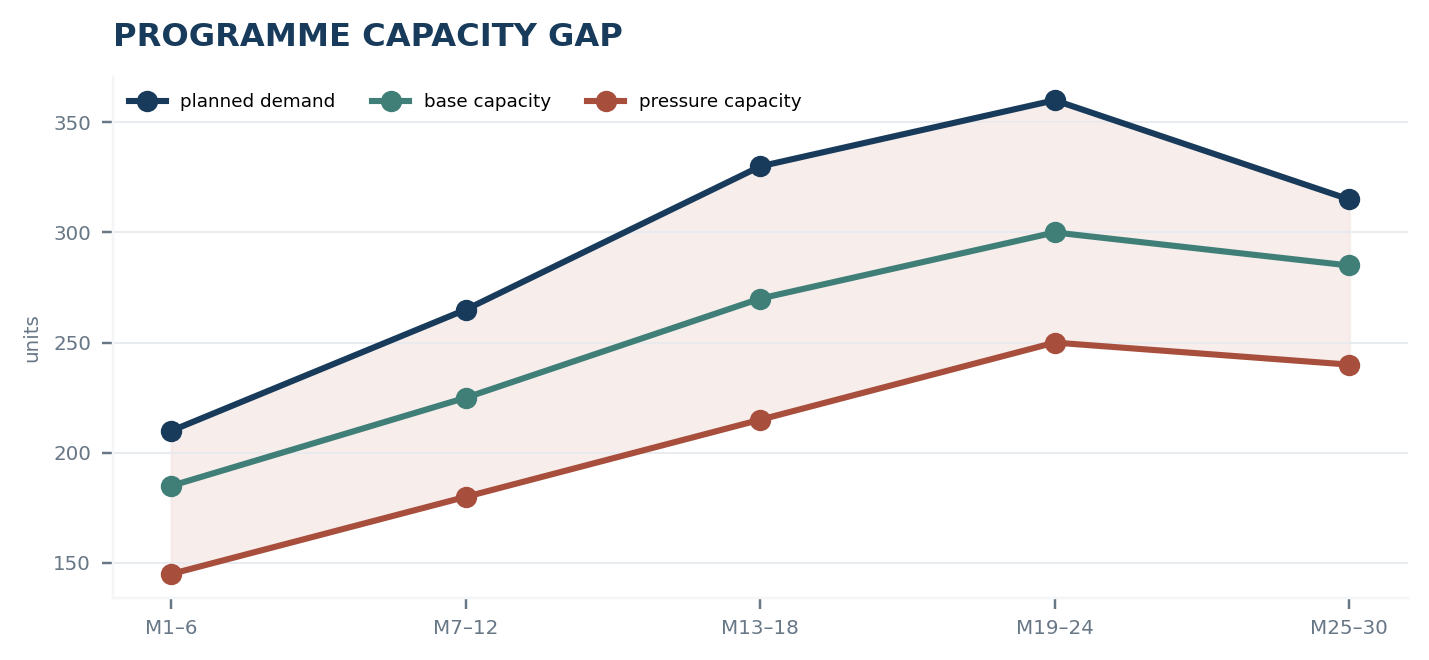
Thirty-one plants appeared relevant at the market level, but only eleven could support the required combinations of transformer class, efficiency, certification and delivery geography. Effective capacity covered 0.82x of base demand and 0.63x under the pressure case.
- Compatibility filters reduced the relevant plant universe from 31 to 11 facilities.
- Core material and winding throughput constrained different transformer classes.
- Nominal nameplate capacity overstated supply that was unallocated and available within the programme window.
All values shown are illustrative and would be rebuilt from the agreed product scope and available evidence.
STRESS AND RESPONSE
The model separated material pressure from factory throughput
Electrical-steel allocation, winding throughput, skilled labour and specification changes were applied separately. This showed which schedule risks could be reduced by earlier ordering and which required an alternate design or supplier-development action.
Response logic
Decision point | Action |
|---|---|
Order sequence | release constrained classes earlier than their project installation date |
Specification | standardise designs where engineering and operating needs allow |
Supplier development | qualify one additional pad-mounted facility against a defined demand tranche |
DECISION OUTCOME
What the analysis would support
ILLUSTRATIVE CONCLUSION Place long-lead orders by transformer class rather than project date, standardise two specifications where operationally acceptable and develop a second compatible facility for the constrained pad-mounted range.
What the client receives
transformer-class demand model | component bottleneck stack |
|---|---|
compatible facility shortlist | order timing and allocation plan |
monthly capacity watchlist |
Delivery
Typical delivery: 8–10 weeks, depending on the number of transformer classes and availability of project demand data.
The final scope is set by the product, geography, tier depth, time horizon and decisions the study must support. Outputs can be supplied as an executive briefing, editable data model and monitoring specification.
Contact Us
DISCUSS YOUR SUPPLY CHAIN QUESTION Tell us which product, facility, sourcing decision or continuity concern you need to examine. August Research will define the dependency boundary, evidence plan and decision outputs around that question.