OIL, GAS + INDUSTRIAL SENSING
Energy-Autonomous Methane Quantification at Remote Assets
Finding the gap between occasional leak detection and continuous, defensible source-rate estimation.
THE R&D DECISION Should an industrial-sensing company develop an off-grid node that detects, localises and quantifies intermittent methane emissions at remote well pads, and which sensor-fusion architecture can operate within a tightly constrained energy budget?
Project background
A sensing company had components for methane concentration measurement but no clear position in emissions quantification. Remote well pads and gathering assets can have intermittent releases, variable wind, multiple potential sources and weak communications. A low-cost detector can identify an elevated concentration, yet that signal does not by itself establish where the gas came from or the emission rate.
Satellite, aircraft, optical gas imaging, mobile surveys and continuous monitors all serve useful roles. The white-space question therefore focused on event capture under low-power conditions: whether an autonomous node could wake on a credible signal, combine concentration and compact meteorology, estimate a source rate at the edge and preserve an auditable uncertainty record.
Technical scope
Boundary | Working definition |
|---|---|
Asset boundary | Remote upstream or midstream sites with several plausible point sources. |
Event boundary | Intermittent plumes lasting minutes to hours, including overlapping or changing sources. |
Power boundary | Solar, battery or harvested power with low average draw and duty-cycled sensing. |
Decision boundary | Detection, source attribution and quantified rate with an explicit confidence score. |
NOTE: The site, performance values and architecture are hypothetical. The regulatory requirement for accurate methane measurement and the sensing approaches are based on public evidence. | |
WHY THE GAP MATTERS
Continuous concentration is not the same as continuous quantification
The EU Methane Regulation establishes rules for accurate measurement, quantification, monitoring, reporting and verification across the energy sector. This increases the value of defensible measurements, but it does not make every available sensing modality equally suitable for short, remote events. The technical gap lies at the intersection of temporal coverage, power, wind-field knowledge, source separation and uncertainty.
The regulatory driver was verified in Regulation (EU) 2024/1787, which covers measurement, quantification, monitoring, reporting and verification of methane emissions.
The technology baseline includes the US Department of Energy ARPA-E MONITOR programme, which supported technologies intended to locate and measure methane emissions cost-effectively.
Algorithm feasibility was checked against a peer-reviewed fixed-monitoring framework, which combines methane concentration and wind data for event detection, localisation and quantification.
Hypothetical performance envelope
Parameter | Working target | Research risk |
|---|---|---|
Average node power | Below 1 W over the full duty cycle | Optical measurement, wind sensing and communications may exceed the budget. |
Event response | Wake and classify within 5 minutes | False triggers can consume energy and create unusable datasets. |
Source-rate range | Approximately 2 to 100 kg CH4/h at 20 to 50 m | Wind uncertainty and multi-source plumes dominate error. |
Quantification uncertainty | Within ±30% under defined conditions | A single node may not constrain the inverse problem sufficiently. |
REFRAMED WHITE-SPACE QUESTION Can an event-driven, multi-sensor node spend energy only when the information value is high, while retaining enough concentration, wind and diagnostic data to produce a defensible emission-rate estimate? | ||
HOW THE RESEARCH WAS EXECUTED
A method built around the unresolved decision
The research reconstructs the events most likely to be missed, then tests whether sensing, inference and power-management components can be combined without assuming that a low-power concentration sensor is already a quantification system.
Research move | Execution | What it resolves |
|---|---|---|
1. Reconstruct missed events | Define duration, rate, wind regime, source count, distance and inspection interval for representative assets. | Shows which emissions escape periodic methods. |
2. Compare observation modes | Map satellites, aircraft, handheld LDAR, imaging and fixed monitors by revisit, detection threshold and quantification method. | Positions the node against complementary tools rather than as a universal replacement. |
3. Decompose the power budget | Estimate sensing, heating, wind measurement, compute, communications and standby energy by operating state. | Identifies the subsystem that prevents autonomy. |
4. Trace the inference chain | Follow concentration signal through event detection, source localisation, dispersion model and uncertainty estimate. | Reveals where information is lost. |
5. Challenge field transfer | Review controlled-release performance, complex terrain, multiple sources, calibration drift and weather exclusions. | Separates laboratory feasibility from operational evidence. |
6. Define architecture territories | Combine wake-up sensors, precision measurement, wind input and edge processing into testable system concepts. | Creates a build, partner or monitor decision. |
Hypothetical research mechanics
Dataset component | Indicative scale | Coding emphasis |
|---|---|---|
Controlled-release studies | 90 to 140 | Rate, distance, wind, source count and error. |
Sensor and component records | 120 to 180 | Power, warm-up, selectivity, drift and environmental range. |
Patents and programmes | 60 to 100 families | Optical path, sensor fusion, inversion and network architecture. |
Rules and measurement protocols | 20 to 35 | Quantification, verification, LDAR and recordkeeping expectations. |
METHOD NOTE: The dataset sizes demonstrate the likely scale of the work. They are not presented as counts from a completed client engagement. | ||
EXAMPLE ANALYTICAL OUTPUT
The Emission-Event Capture Map
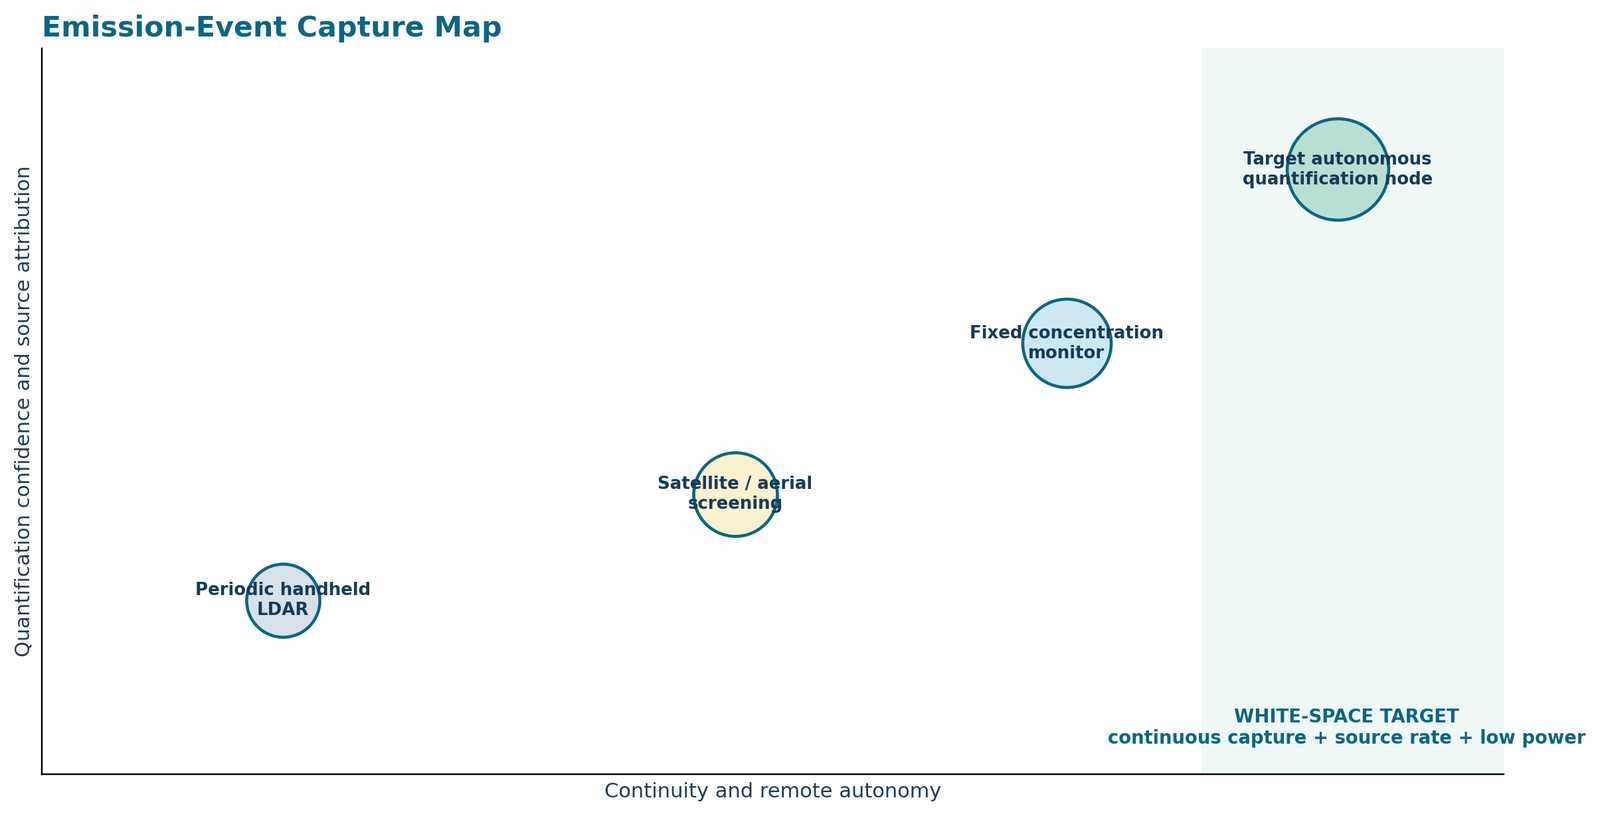
The map compares observation approaches on two decision variables: whether they can remain present for an intermittent event and whether they can produce a confident source-rate estimate. The target is not simply the upper-right corner. It must reach that region while remaining off-grid and economically deployable.
How the output would be interpreted
- Periodic handheld LDAR can locate equipment-level leaks but may miss events that begin and end between surveys.
- Satellite and aerial observations provide wide-area screening, yet revisit timing, clouds, wind and detection limits influence event capture.
- A fixed concentration monitor improves continuity, but source rate remains sensitive to sensor placement and wind-field uncertainty.
- The research target is a duty-cycled architecture in which an inexpensive wake-up channel activates a more precise measurement and inference sequence only during credible events.
WEBSITE PRESENTATION SUGGESTION Animate a short methane event across the map. As the event duration and wind variability change, each observation bubble should show whether it detects, localises and quantifies the release. A power-budget drawer can reveal which subsystem consumes energy in each node state.
RESEARCH TERRITORIES AND DECISION
Research territories that survived the challenge review
The work narrows the broad topic into a small number of testable territories. Each territory combines a technical premise, a reason it may remain underexplored and a clear falsification condition.
Territory A | Wake-on-event dual-sensor node
Use an always-on ultra-low-power channel to trigger a higher-information optical or photoacoustic measurement only when plume evidence persists.
Disqualifier: False triggers, warm-up time or cross-sensitivity consume the energy saved by duty cycling.
Territory B | Energy-aware plume inversion
Adapt the quantification algorithm to choose measurement duration, sampling rate and communication based on wind stability and uncertainty reduction.
Disqualifier: Sparse observations cannot constrain source location and rate at the required confidence.
Territory C | Self-diagnosing remote confidence layer
Track calibration drift, obstruction, wind-sensor health and model validity so each estimate carries an auditable quality status.
Disqualifier: Diagnostics require periodic reference gas or maintenance that defeats remote autonomy.
INDICATIVE DECISION Advance an architecture study before committing to a sensor platform. The first technical gate should model event capture and energy use together, then use controlled-release evidence to determine whether one node or a small network is necessary.
DELIVERABLES AND NEXT STEP
What the project output could look like
Missed-event library
A set of representative emission scenarios showing rate, duration, wind, source geometry and why current observation modes could miss or misclassify them.
Modality and architecture comparison
A decision matrix linking sensors, wind measurements, inference methods, power states, communications and maintenance burden.
Node power and uncertainty model
A spreadsheet or model that exposes average power, event frequency, battery autonomy and the uncertainty contribution of each subsystem.
Validation roadmap
Controlled-release cases, environmental exclusions, calibration checks and field gates needed before regulatory or inventory use can be considered.
Indicative project delivery
A focused engagement could take approximately 8 to 10 weeks. Duration will depend on the asset geometries included, access to controlled-release datasets and the level of component-level patent review. Secondary research timelines remain sensitive to source availability and technical response time.
LET'S DISCUSS YOUR PROJECT If your methane-monitoring concept must work at an off-grid asset, we can define the event library, power ceiling and required confidence before assessing whether the opportunity is a new device, an inference layer or a network architecture.
NOTE: Recommendations remain conditional on the agreed search boundary, evidence quality and client-specific performance requirements. Laboratory validation, regulatory advice and commercial due diligence would be separate workstreams where required.